In Louisville, Black students and white students now graduate at nearly identical rates. Jefferson County Public Schools, the state's largest district, posted a 1.1 percentage point gap between white and Black graduates in 2024-25, down from 4.7 points five years earlier. In 2023-24, Black students in the district actually outpaced their white peers, 89.1% to 88.2%.
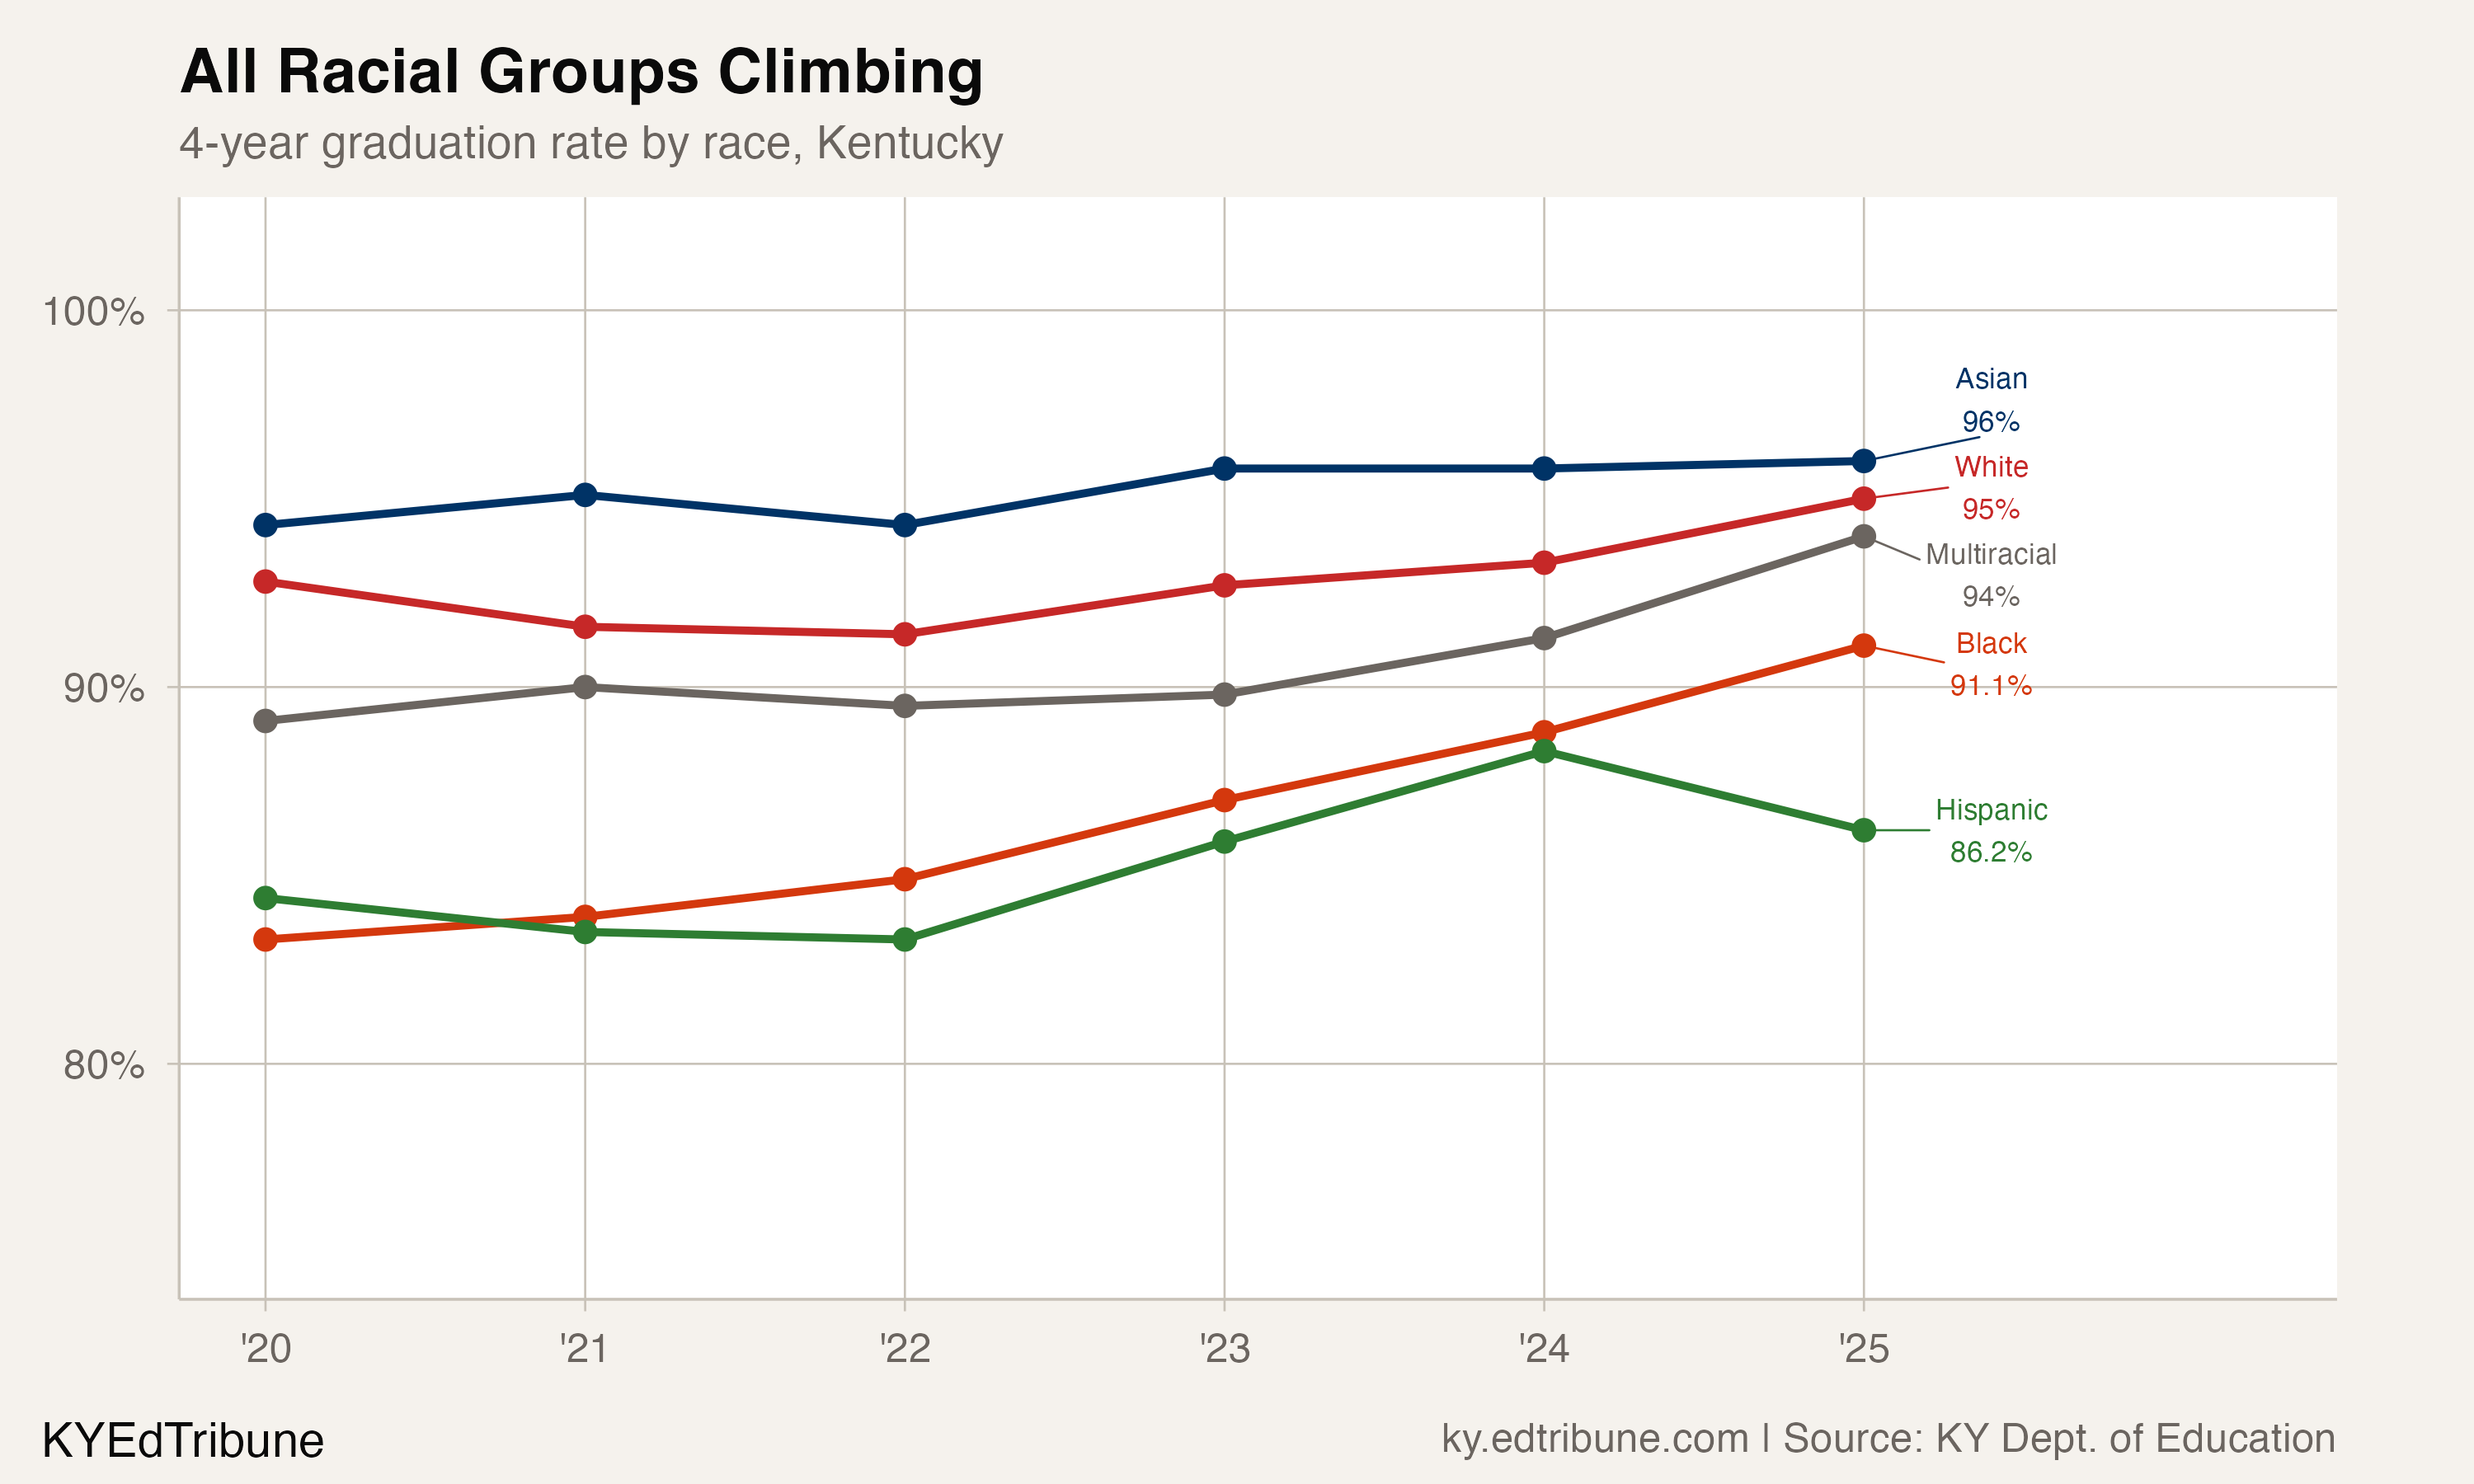
That district-level convergence reflects a statewide pattern. Kentucky's white-Black graduation gap fell to 3.9 percentage points in 2024-25, with white students at 95.0% and Black students at 91.1%. Five years ago the gap was 9.5 points. Nationally, the gap between white and Black four-year graduation rates stands at about 9 percentage points, with white students at 90% and Black students at 81%. Kentucky's Black students graduate at a higher rate than the national average for white students.
A gap that shrank every year
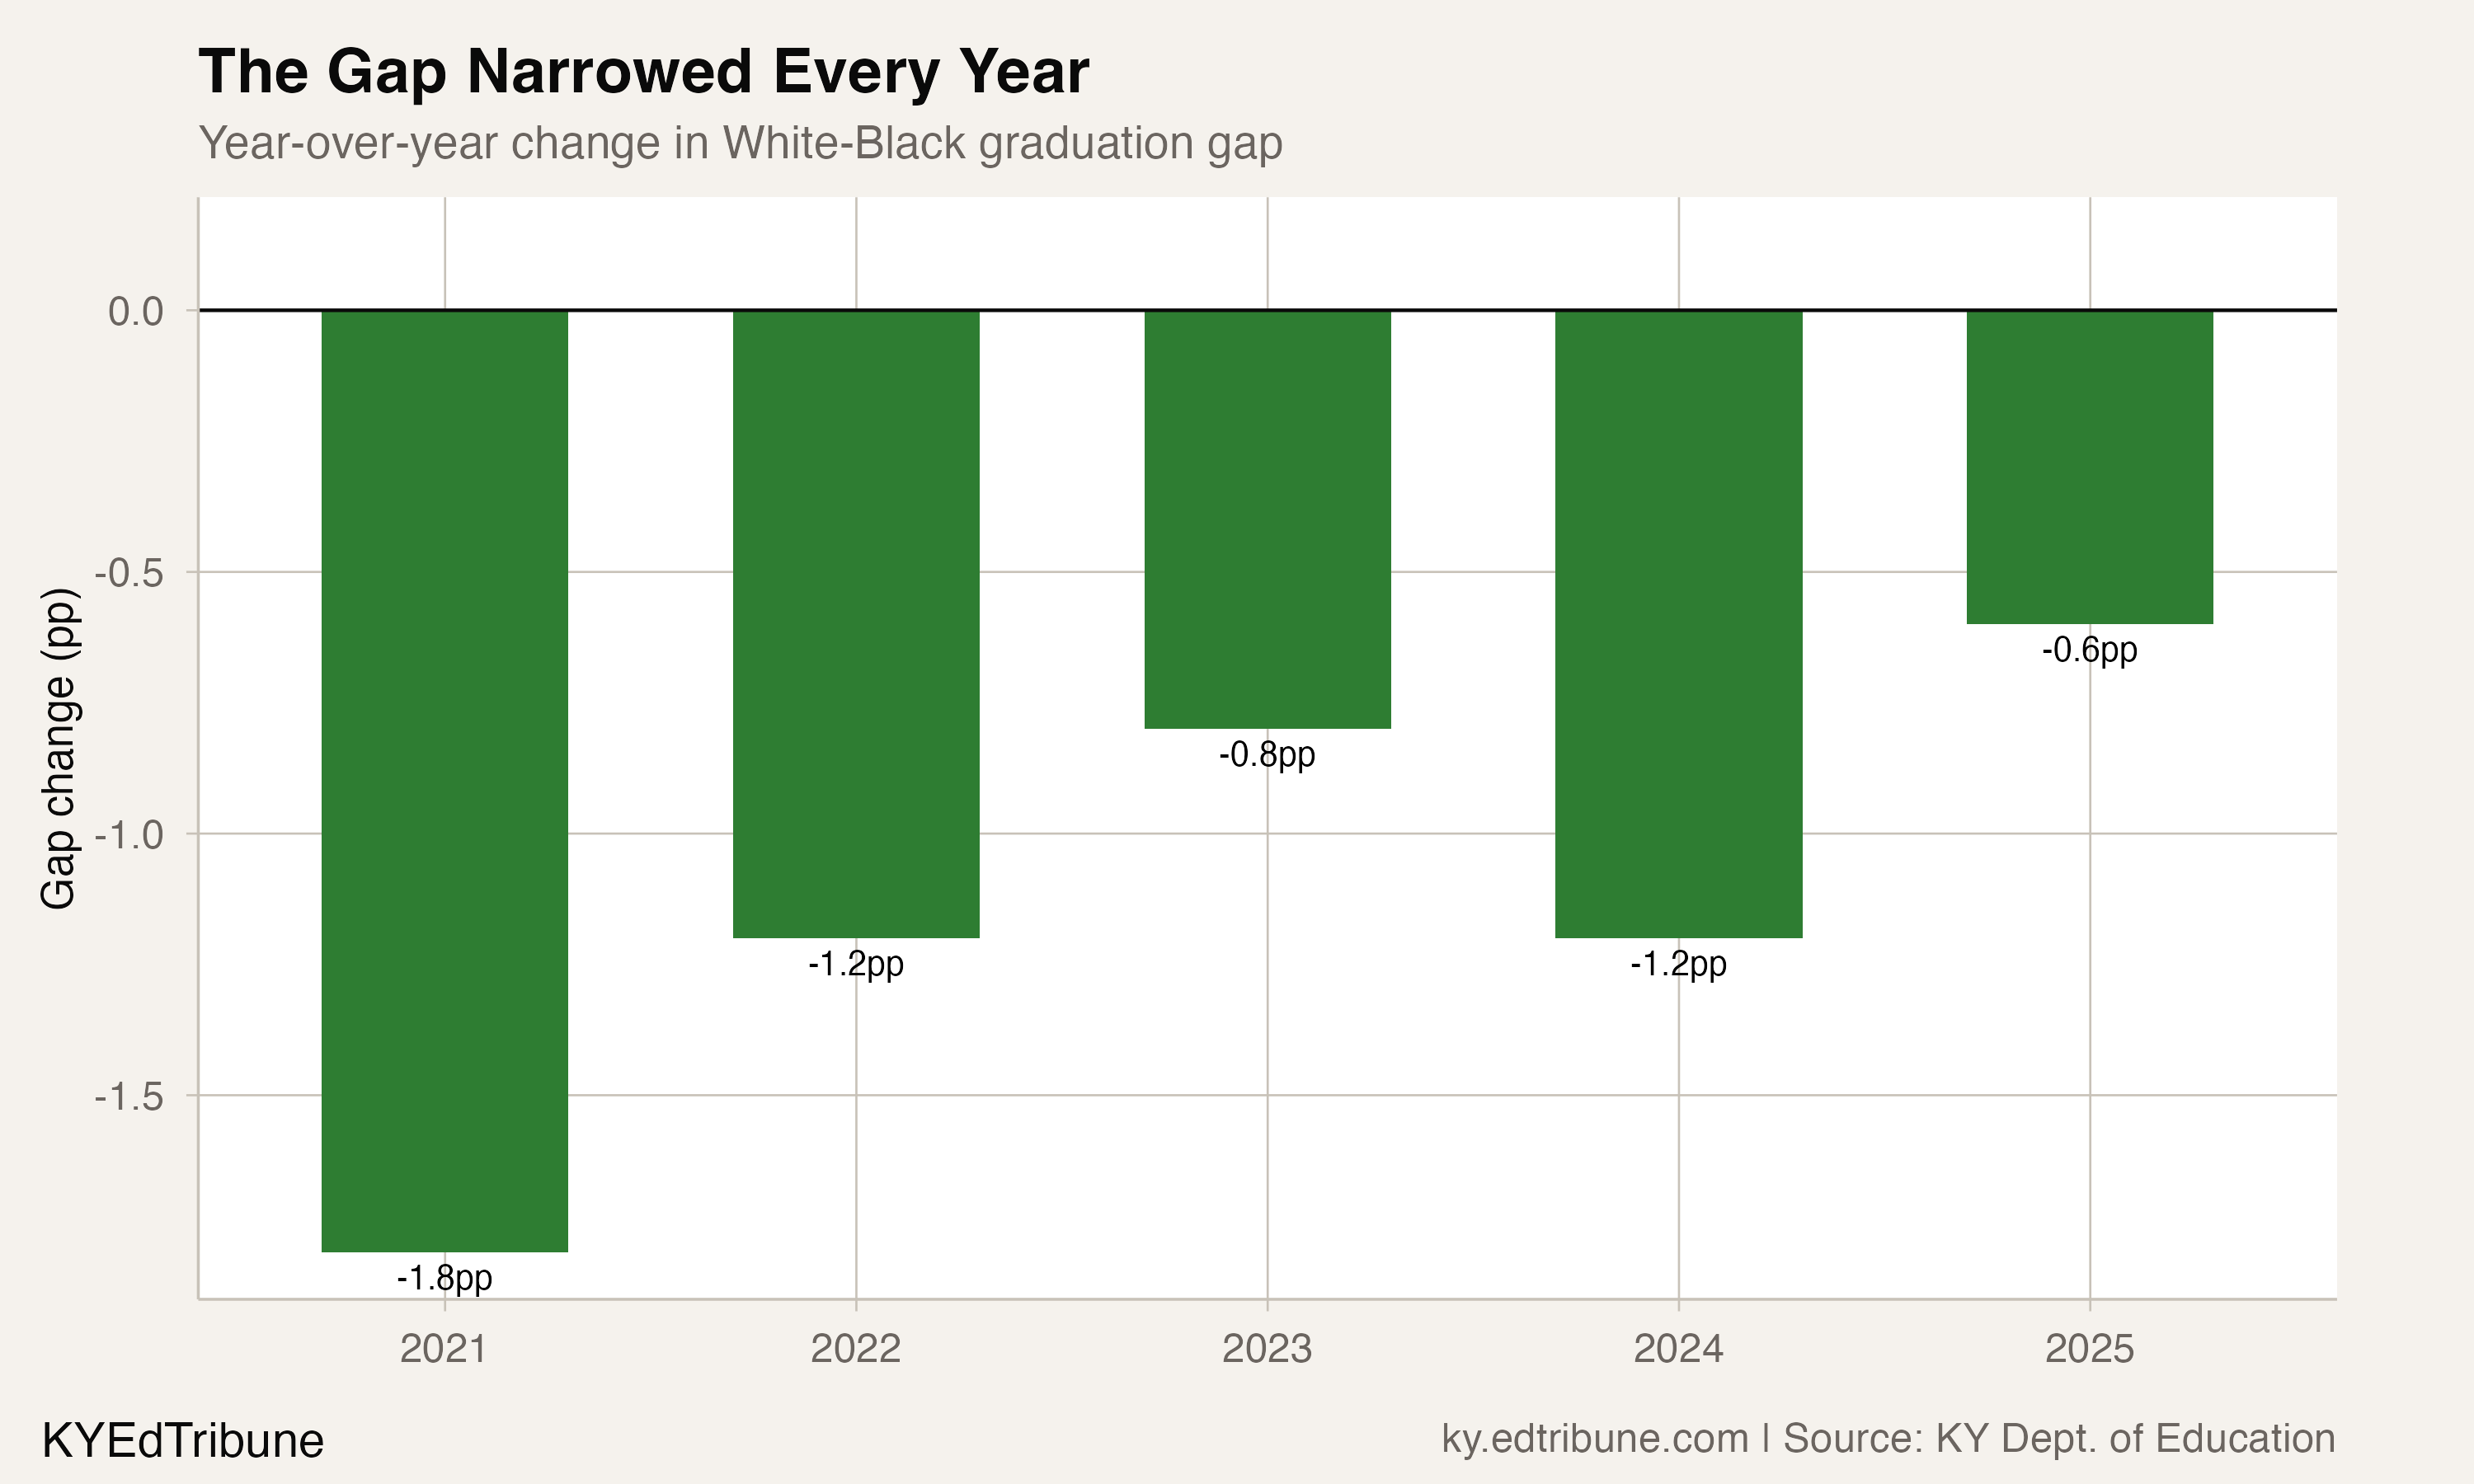
The narrowing was not a single jump. Black students gained ground in every year from 2020 to 2025, climbing from 83.3% to 91.1%, an improvement of 7.8 percentage points. White students also improved, from 92.8% to 95.0%, but their 2.2-point gain was less than a third as large. The gap shrank in every one of the five years measured, with the largest single-year narrowing (1.8 points) coming between 2020 and 2021.
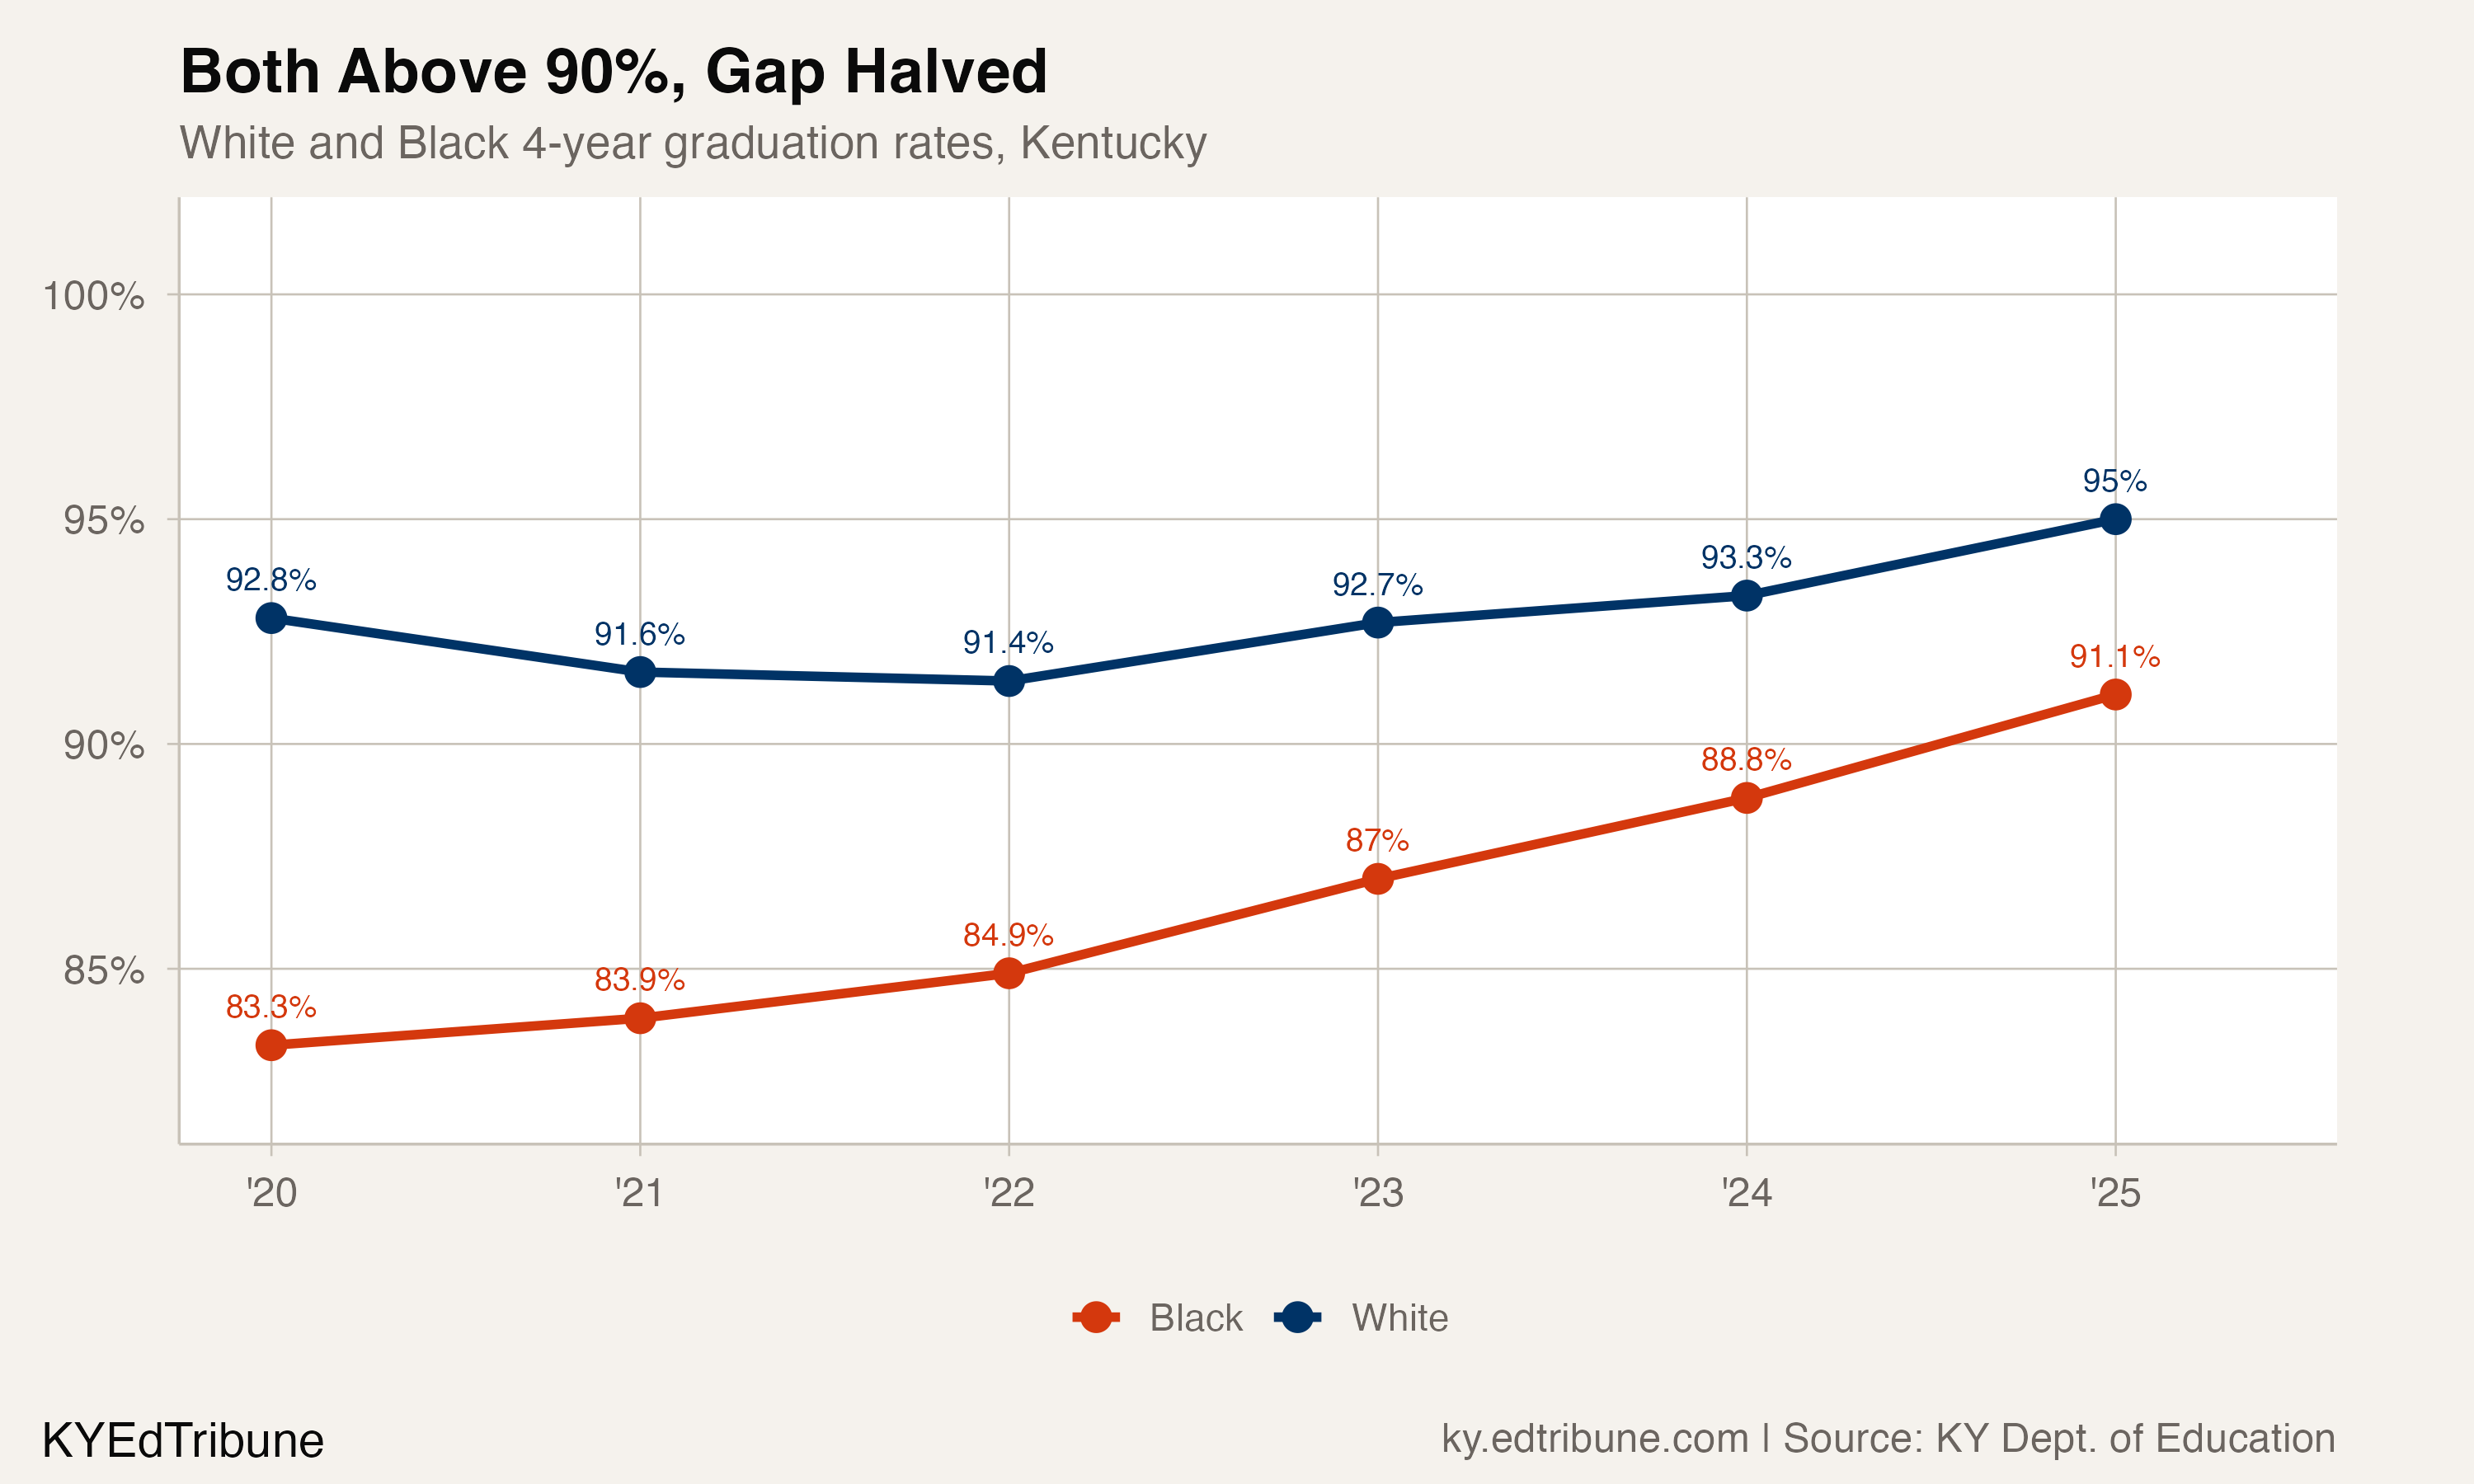
What makes the 3.9-point gap notable is not just its size but the altitude at which it occurs. Both groups are above 90%. In most states with narrow racial graduation gaps, the convergence happens at lower rates, with white students in the mid-80s and Black students trailing a few points behind. Kentucky achieved it with both groups in the 90s.
Louisville's role in the statewide picture
Jefferson County Public Schools enrolls roughly 90,000 students and accounts for a disproportionate share of the state's Black student population. The district's own gap trajectory tells much of the story. In 2019-20, JCPS graduated 86.3% of white students and 81.6% of Black students, a 4.7-point gap. By 2024-25 that stood at 1.1 points. In between, the district briefly eliminated the gap entirely: Black students graduated at 89.1% in 2023-24, compared to 88.2% for white students.
JCPS Superintendent Marty Pollio has attributed the gains partly to the Academies of Louisville, a career-pathway restructuring of the district's high schools, and the Explore program in middle schools.
"Our graduation rate has gone from 82% to 88% with the gap between white and Black students virtually erased." -- Yahoo News / Courier Journal, 2024
The racial gap in context
At 3.9 points, the white-Black graduation gap is Kentucky's narrowest racial disparity. The white-Hispanic gap is wider at 8.8 points (95.0% vs. 86.2%). English learners face the steepest cliff: a 14.6-point gap from the state average. Students with disabilities trail by 10.5 points. Students in foster care trail by 11.1 points.
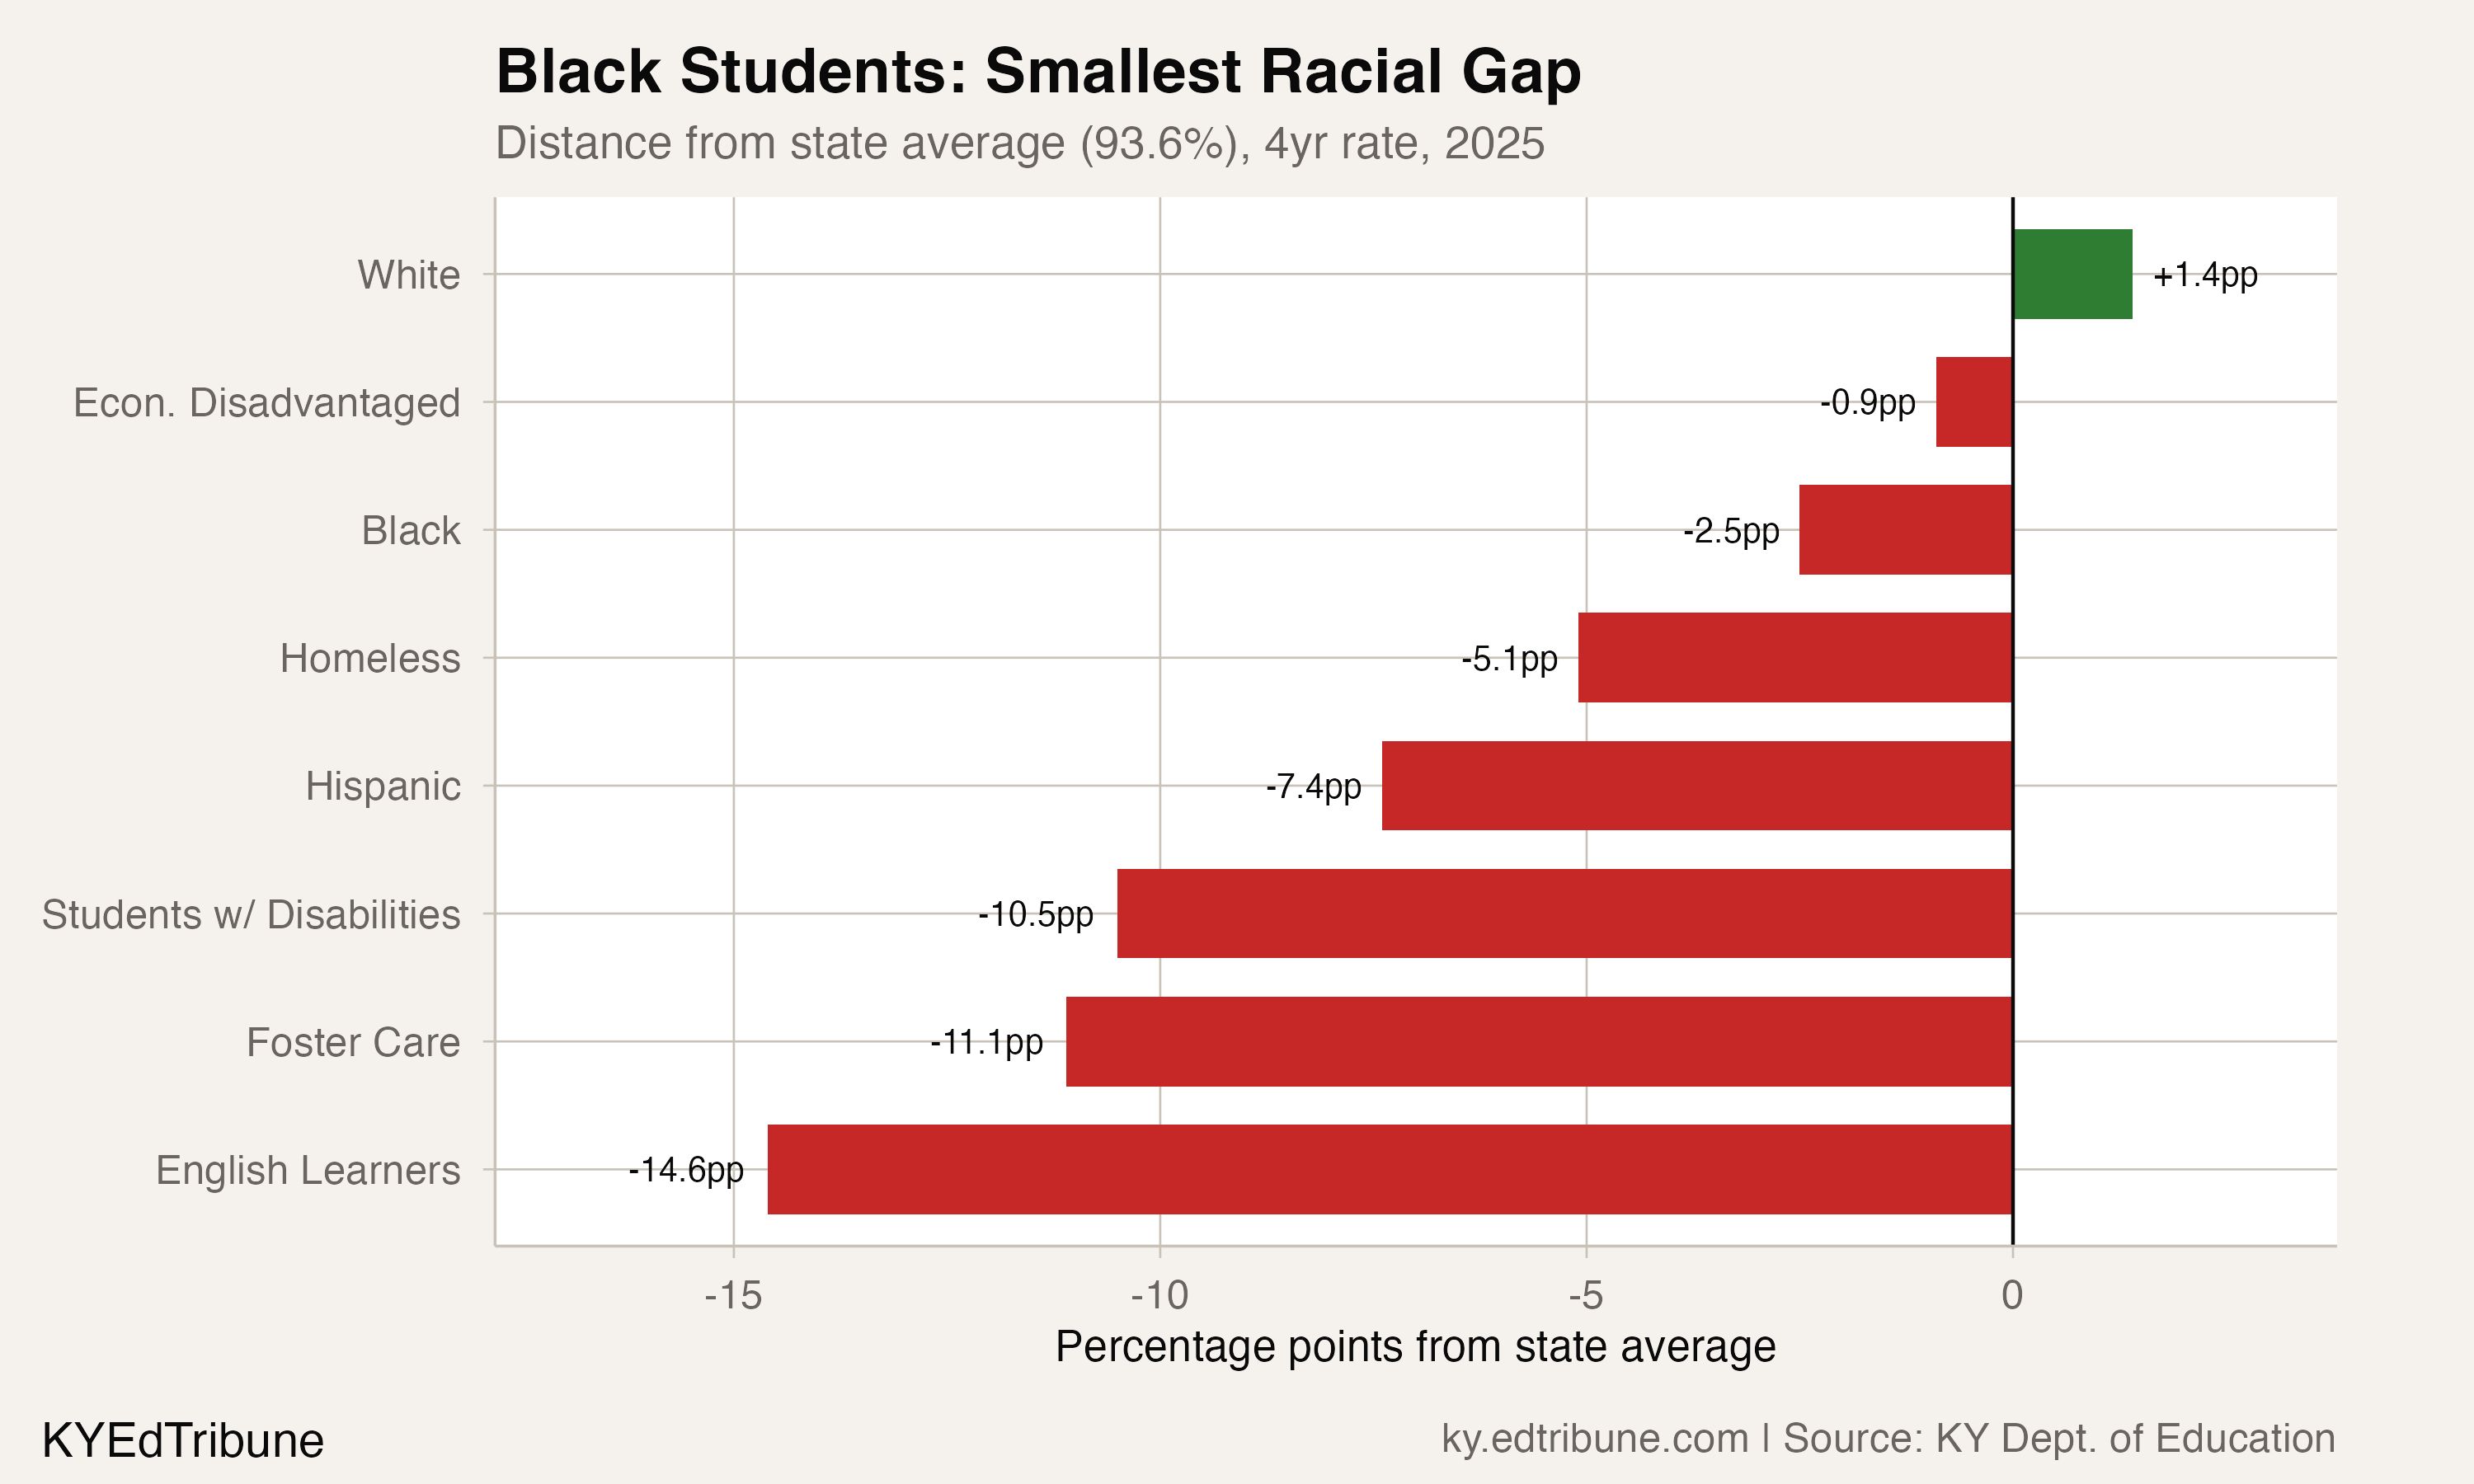
Black students, in other words, are closer to parity with their white peers than any other historically underserved group. That was not the case in 2020, when the 9.5-point white-Black gap was wider than the economically disadvantaged gap (3.0 points below the state average). Black students have essentially leapfrogged from the back of the line to the front.
Twenty-one districts where Black students lead
In 21 of the 43 Kentucky districts that report graduation rates for both racial groups, Black students graduated at a higher rate than white students in 2024-25. Many of these are smaller districts where a handful of additional graduates can swing the rate significantly, but the pattern is not exclusively small-district noise. Fayette County (Lexington), the state's second-largest district, posted a gap of just 0.8 points (white 94.8%, Black 94.0%).
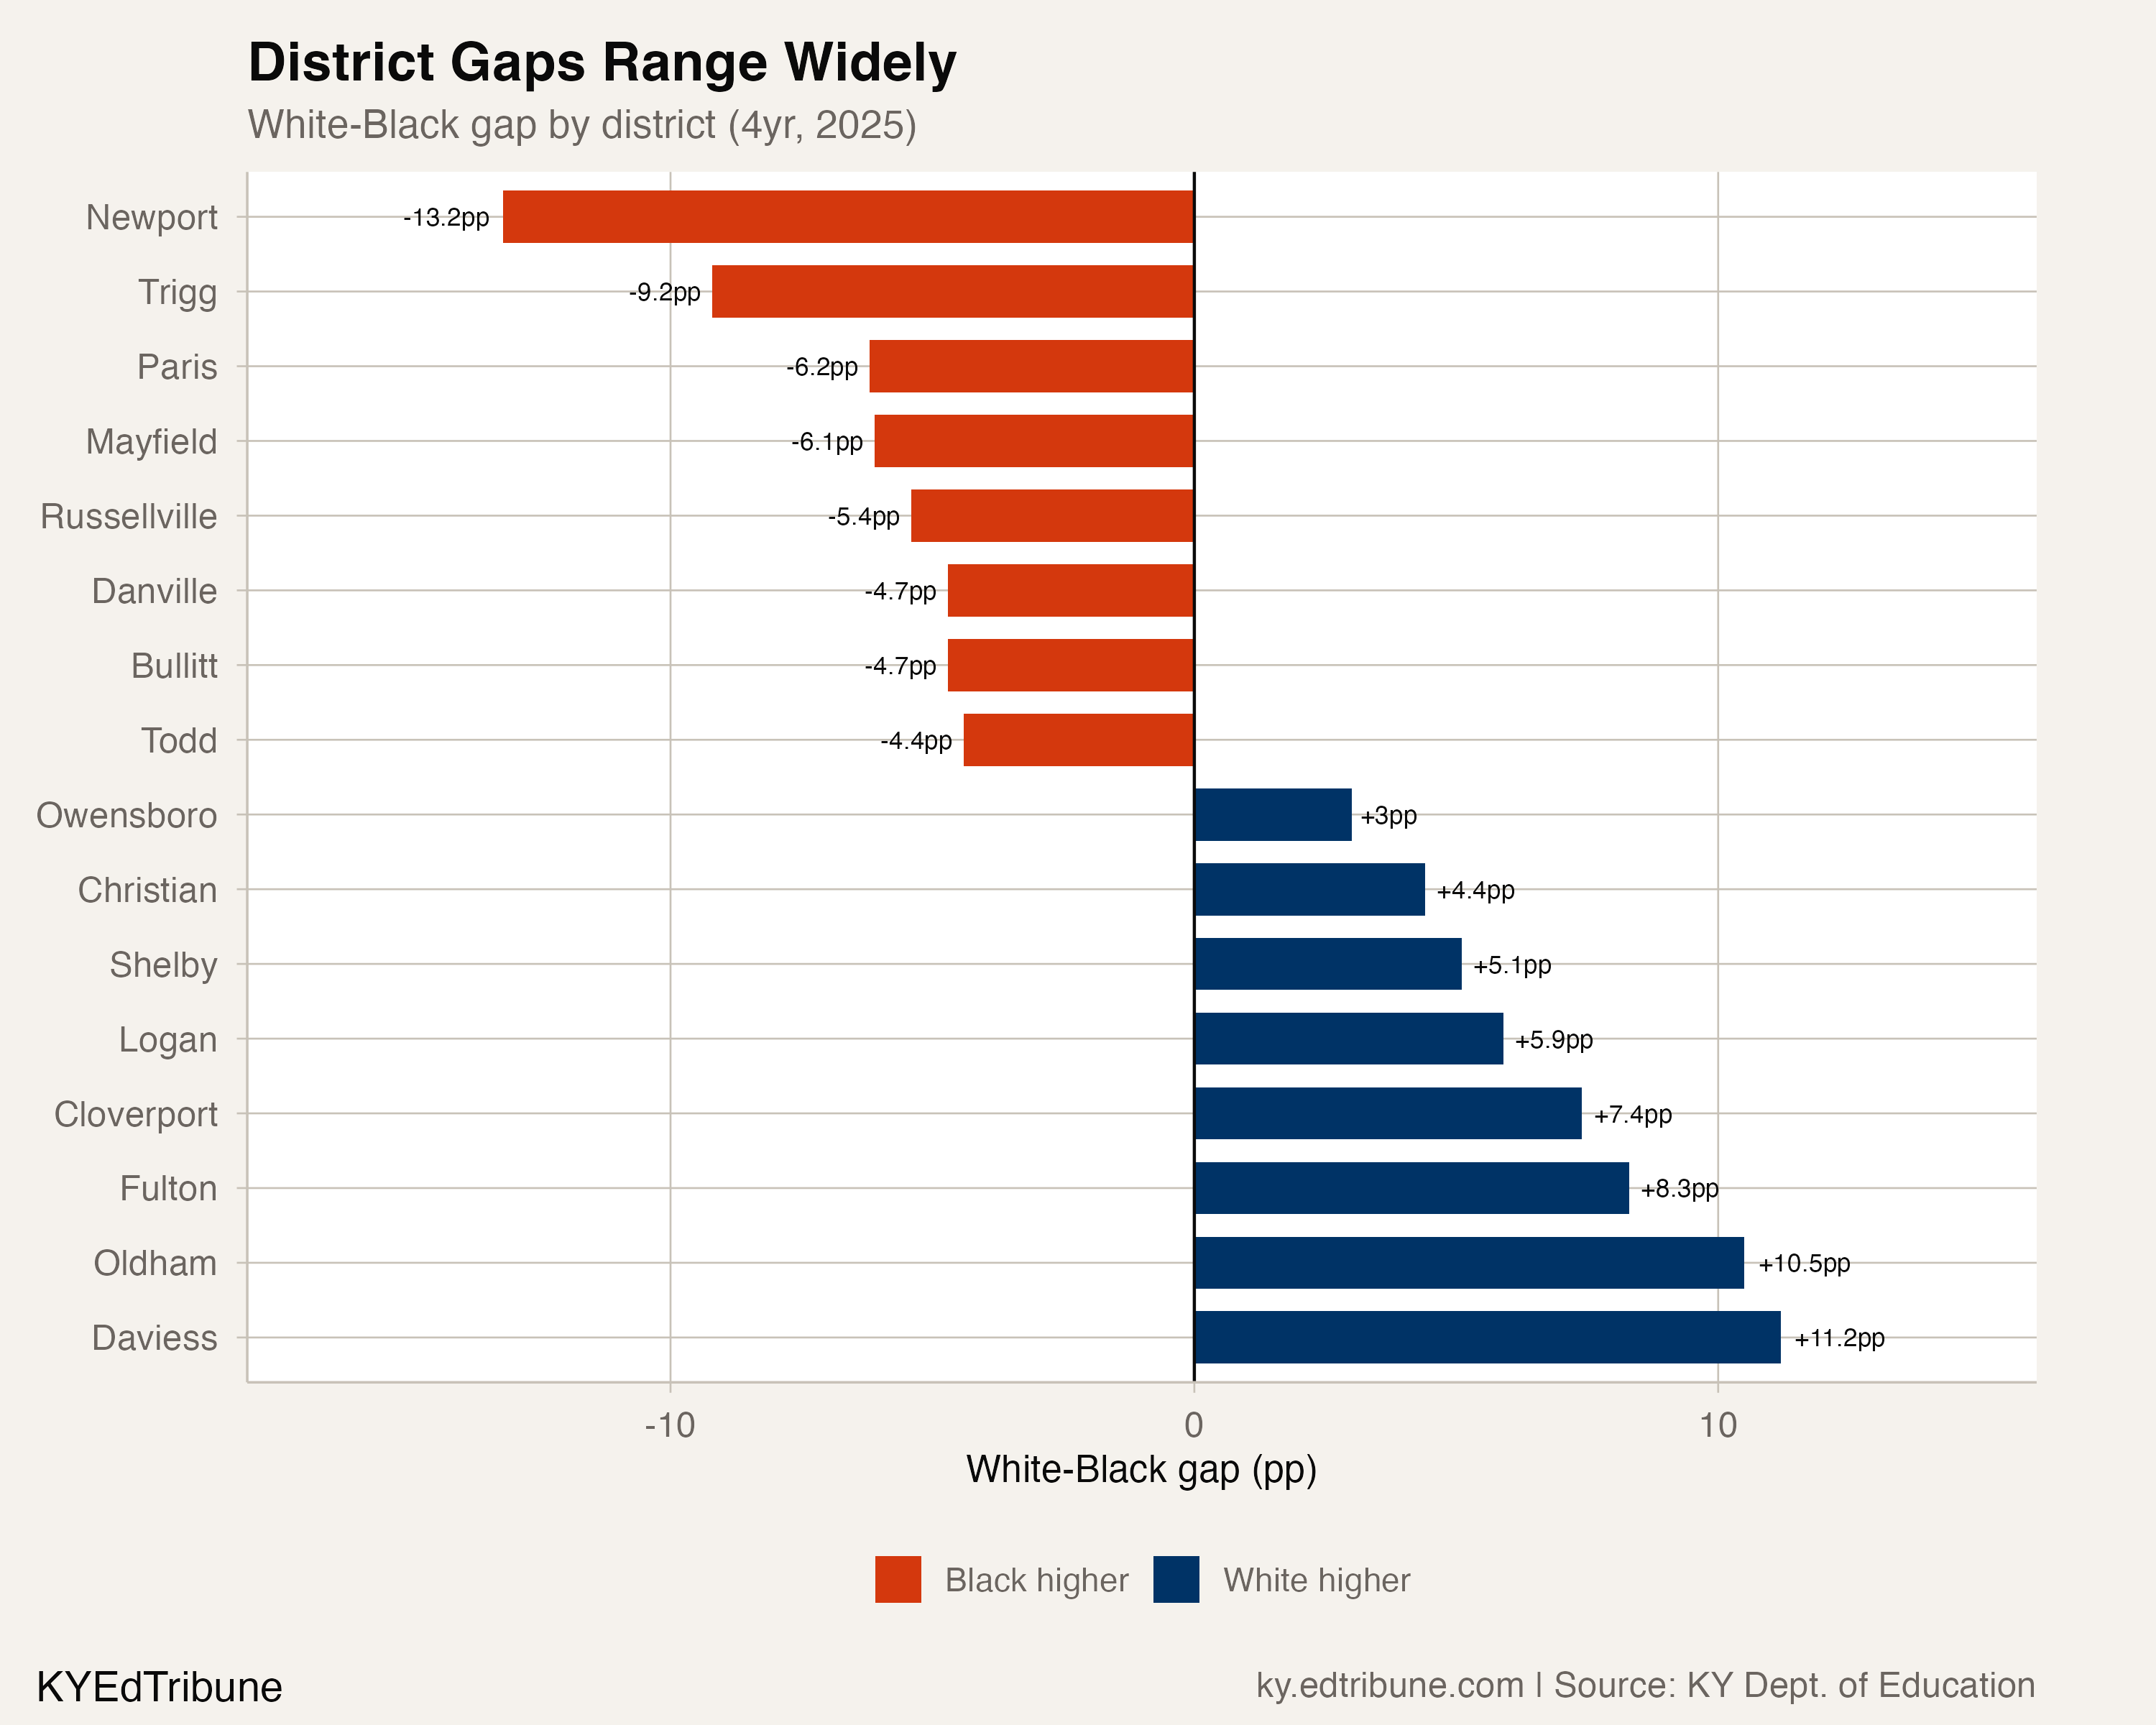
At the other extreme, Daviess County posted an 11.2-point gap favoring white students, and Oldham County had a 10.5-point gap. These are not small districts. The statewide average masks real variation.
The KERA foundation
Kentucky's graduation progress did not start with this data window. The Kentucky Education Reform Act of 1990 provided for equal funding across all school districts based on enrollment, a landmark restructuring of how Kentucky funded public education. A 2016 report from Johns Hopkins' Everyone Graduates Center, "For All Kids," found that Kentucky was one of just six states where low-income students graduated above the national average, attributing that performance to KERA's equity-focused funding formula and statewide accountability system.
The current data sits on top of that three-decade investment. Whether KERA is sufficient to explain the racial gap narrowing specifically, or whether more recent interventions like Louisville's career academies played a larger role, is not something the graduation rate data alone can answer.
All five racial groups rising
Every racial group tracked in the data improved between 2020 and 2025. Asian students lead at 96.0%, followed by white students (95.0%), multiracial students (94.0%), Native American students (93.4%), and Black students (91.1%). Hispanic students sit lowest at 86.2%, though they climbed from 84.4%. The fact that all five groups are above 85%, and four are above 90%, is unusual nationally.
The Prichard Committee for Academic Excellence has noted that while graduation rates show convergence, academic assessment gaps remain: English learners, students with disabilities, Black students, and economically disadvantaged students often score 20 points lower than their peers on state assessments. A diploma and a proficient education are not the same thing, and the graduation story does not necessarily translate to the achievement story.
What comes next
The gap compressed by 5.6 points in five years. If it narrows another point, Kentucky would approach statistical parity between white and Black graduation rates, a threshold almost no state has reached. The question is whether the remaining 3.9 points follow the same trajectory or prove harder to close, the way the last few percentage points of any improvement often do. Black students at 91.1% are above the national average for all students combined. The gap that remains is not between failure and success. It is between high performance and higher performance.
Detailed code that reproduces the analysis and figures in this article is available exclusively to EdTribune subscribers.
Discussion
Sign in to join the discussion.
Loading comments...