Seven districts in Kentucky graduated every single student with a disability in 2024-25. Not a symbolic number. Literal 100%, from Edmonson County in the south-central Pennyrile region to Ludlow Independent, a 700-student district tucked against the Ohio River in Northern Kentucky. Their cohorts were small, the kind of result that can happen when six or eight students all walk. But the fact that seven districts reached that mark in the same year, and that the state's overall rate for students with disabilities hit 83.1%, points to something structural rather than coincidental.
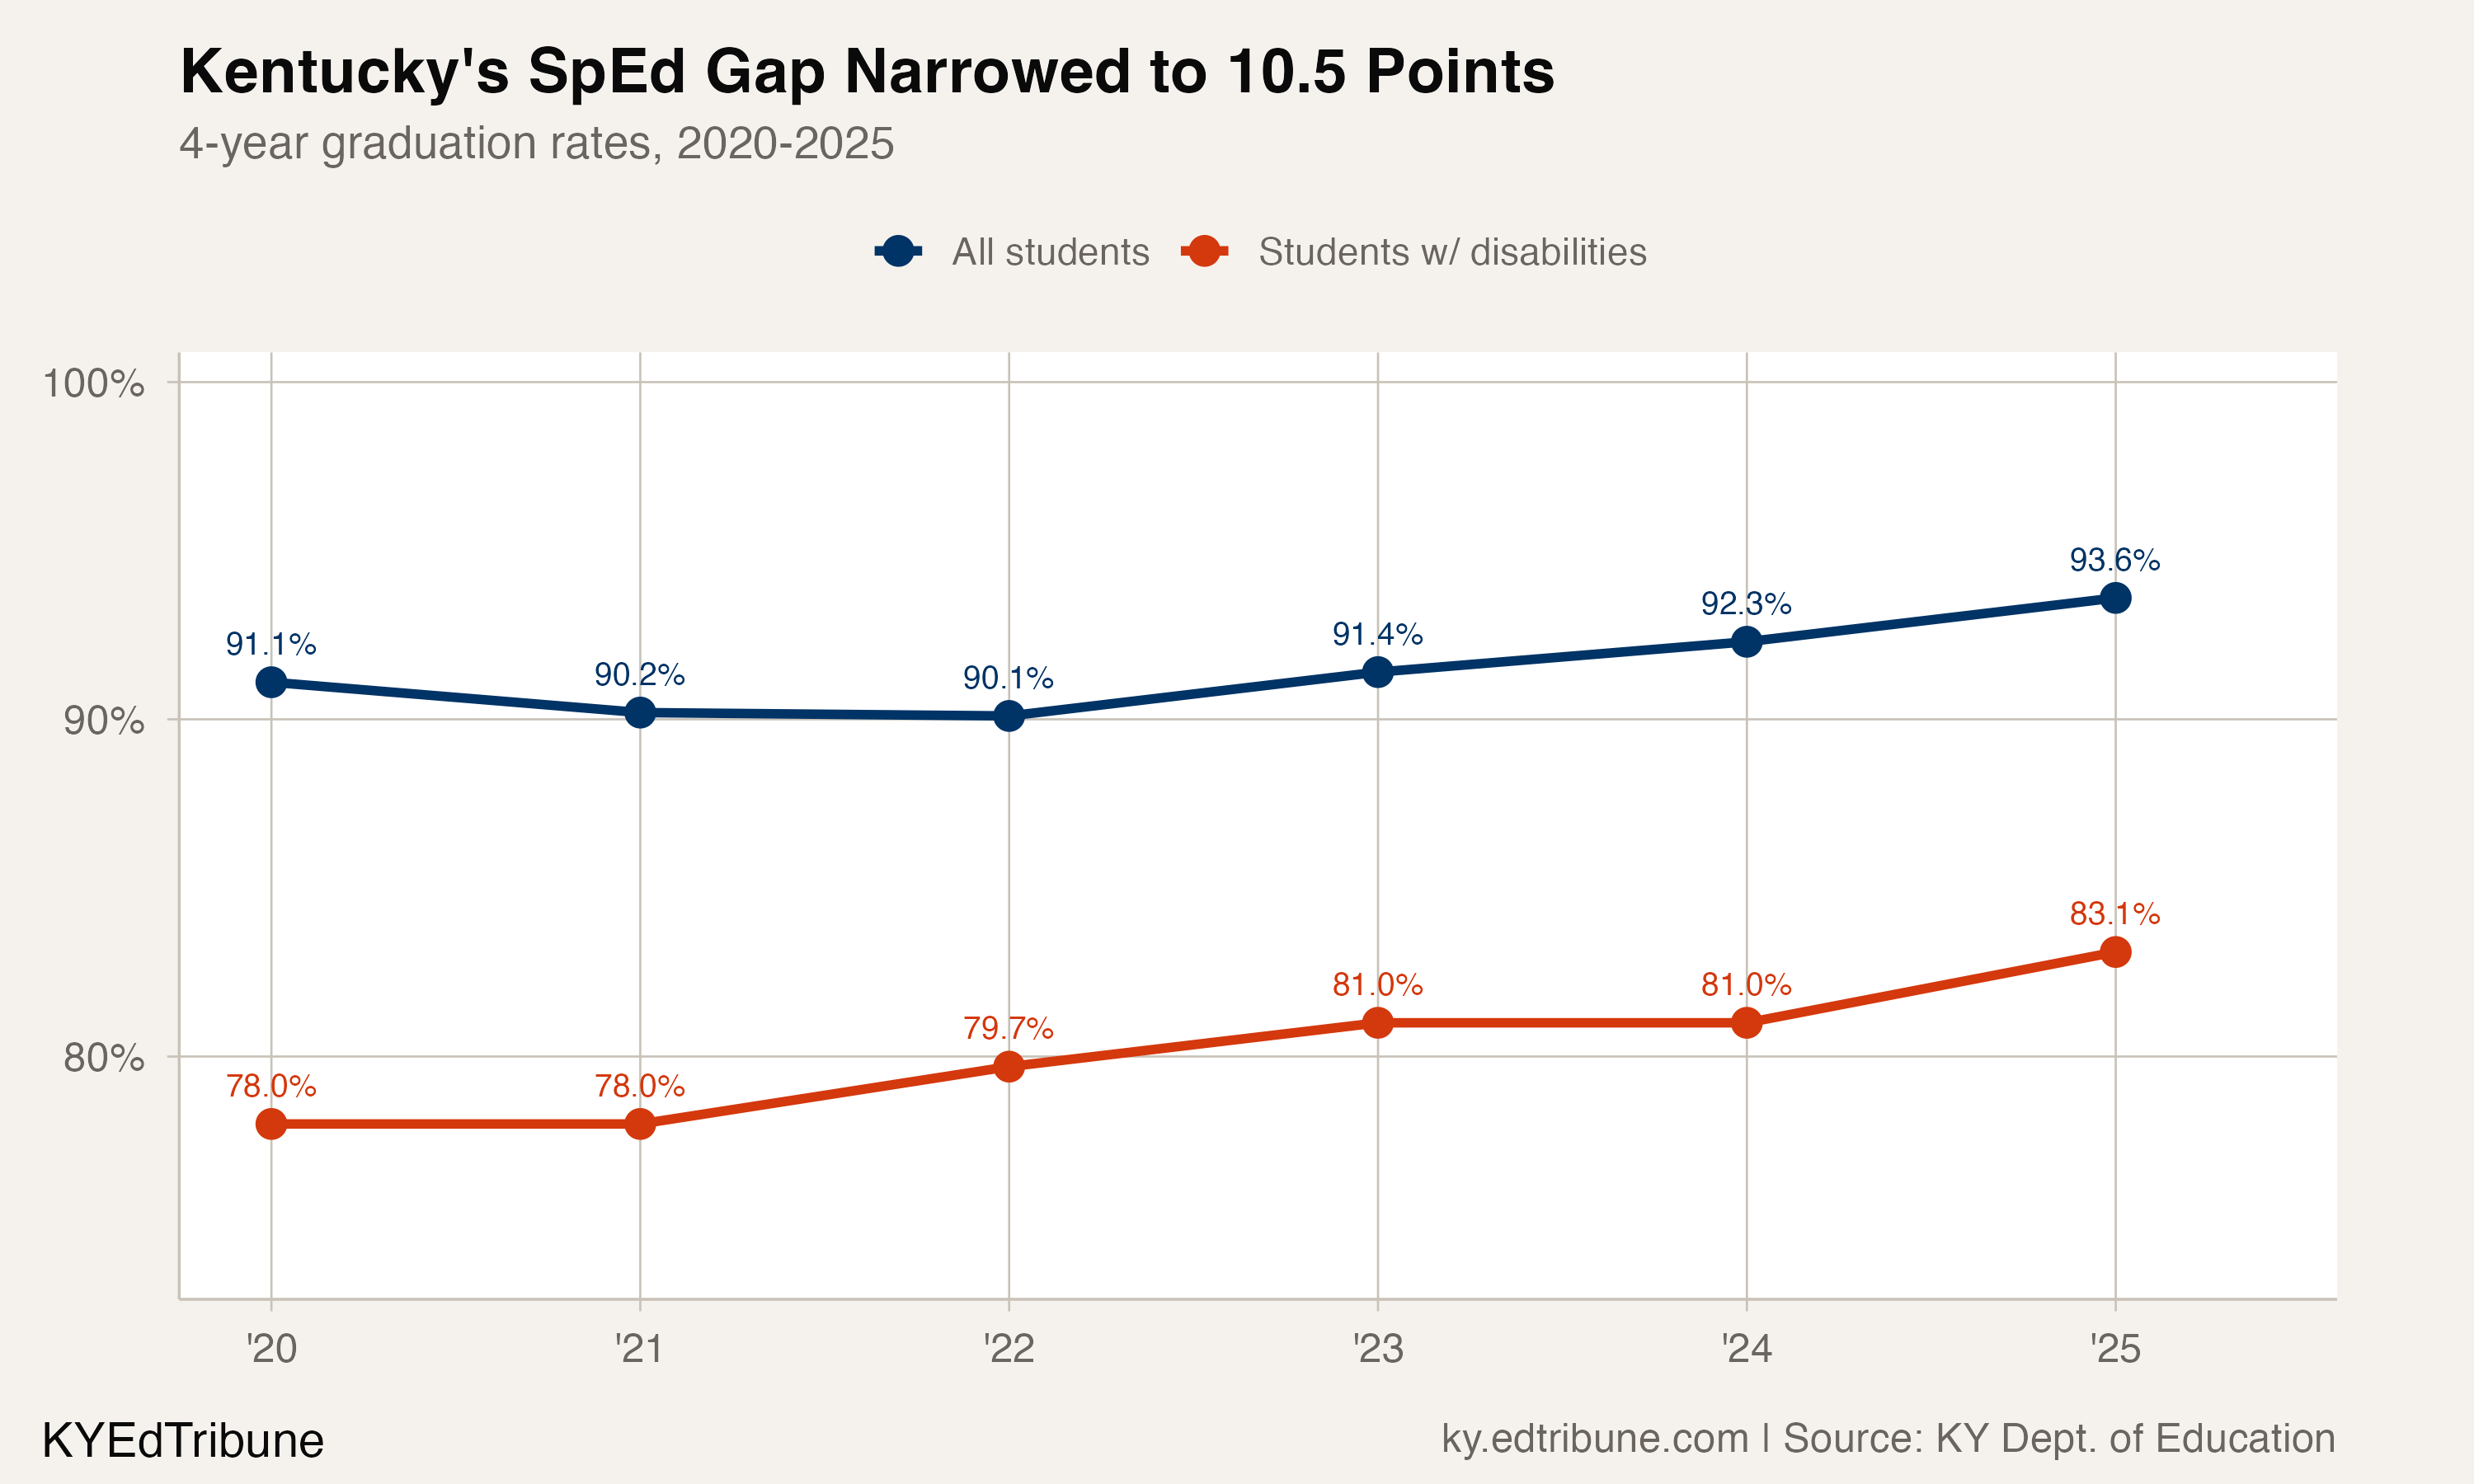
Kentucky's four-year graduation rate for students with individualized education programs rose 5.1 percentage points in five years, from 78.0% in 2019-20 to 83.1% in 2024-25. The gap between these students and the all-student rate of 93.6% now stands at 10.5 points.
That number is worth pausing on. The most recent federal data, from 2021-22, show students with disabilities graduating at 74% nationally, against an all-student rate of 87%, a 13-point gap. Kentucky's 83.1% rate exceeds many states' overall graduation rates, and its 10.5-point gap is narrower than the national norm by a meaningful margin.
The federal record backs this up
Kentucky is not a state where special education outcomes are a sore point. The U.S. Department of Education's Office of Special Education and Rehabilitative Services has given Kentucky a "Meets Requirements" rating for 16 consecutive years, placing it among 20 states and territories that earned the top designation in 2025. That evaluation, conducted through the Results Driven Accountability framework, weighs both compliance with IDEA requirements and results-based indicators including graduation rates, assessments, and post-school outcomes.
Sixteen consecutive years of top marks is not something that happens by accident. It reflects a system that has treated special education as a compliance obligation and an instructional priority.
Where the gap sits among subgroups
At 10.5 points, the special education gap is the third widest among Kentucky's student populations in 2024-25, trailing only English learners (14.6 points below the state average, at 79.0%) and students in foster care (11.1 points below, at 82.5%). But the comparison that stands out is economically disadvantaged students, who graduated at 92.7%, just 0.9 points below the state average. That gap has effectively closed over five years, from 3.0 points in 2020 to under a point.
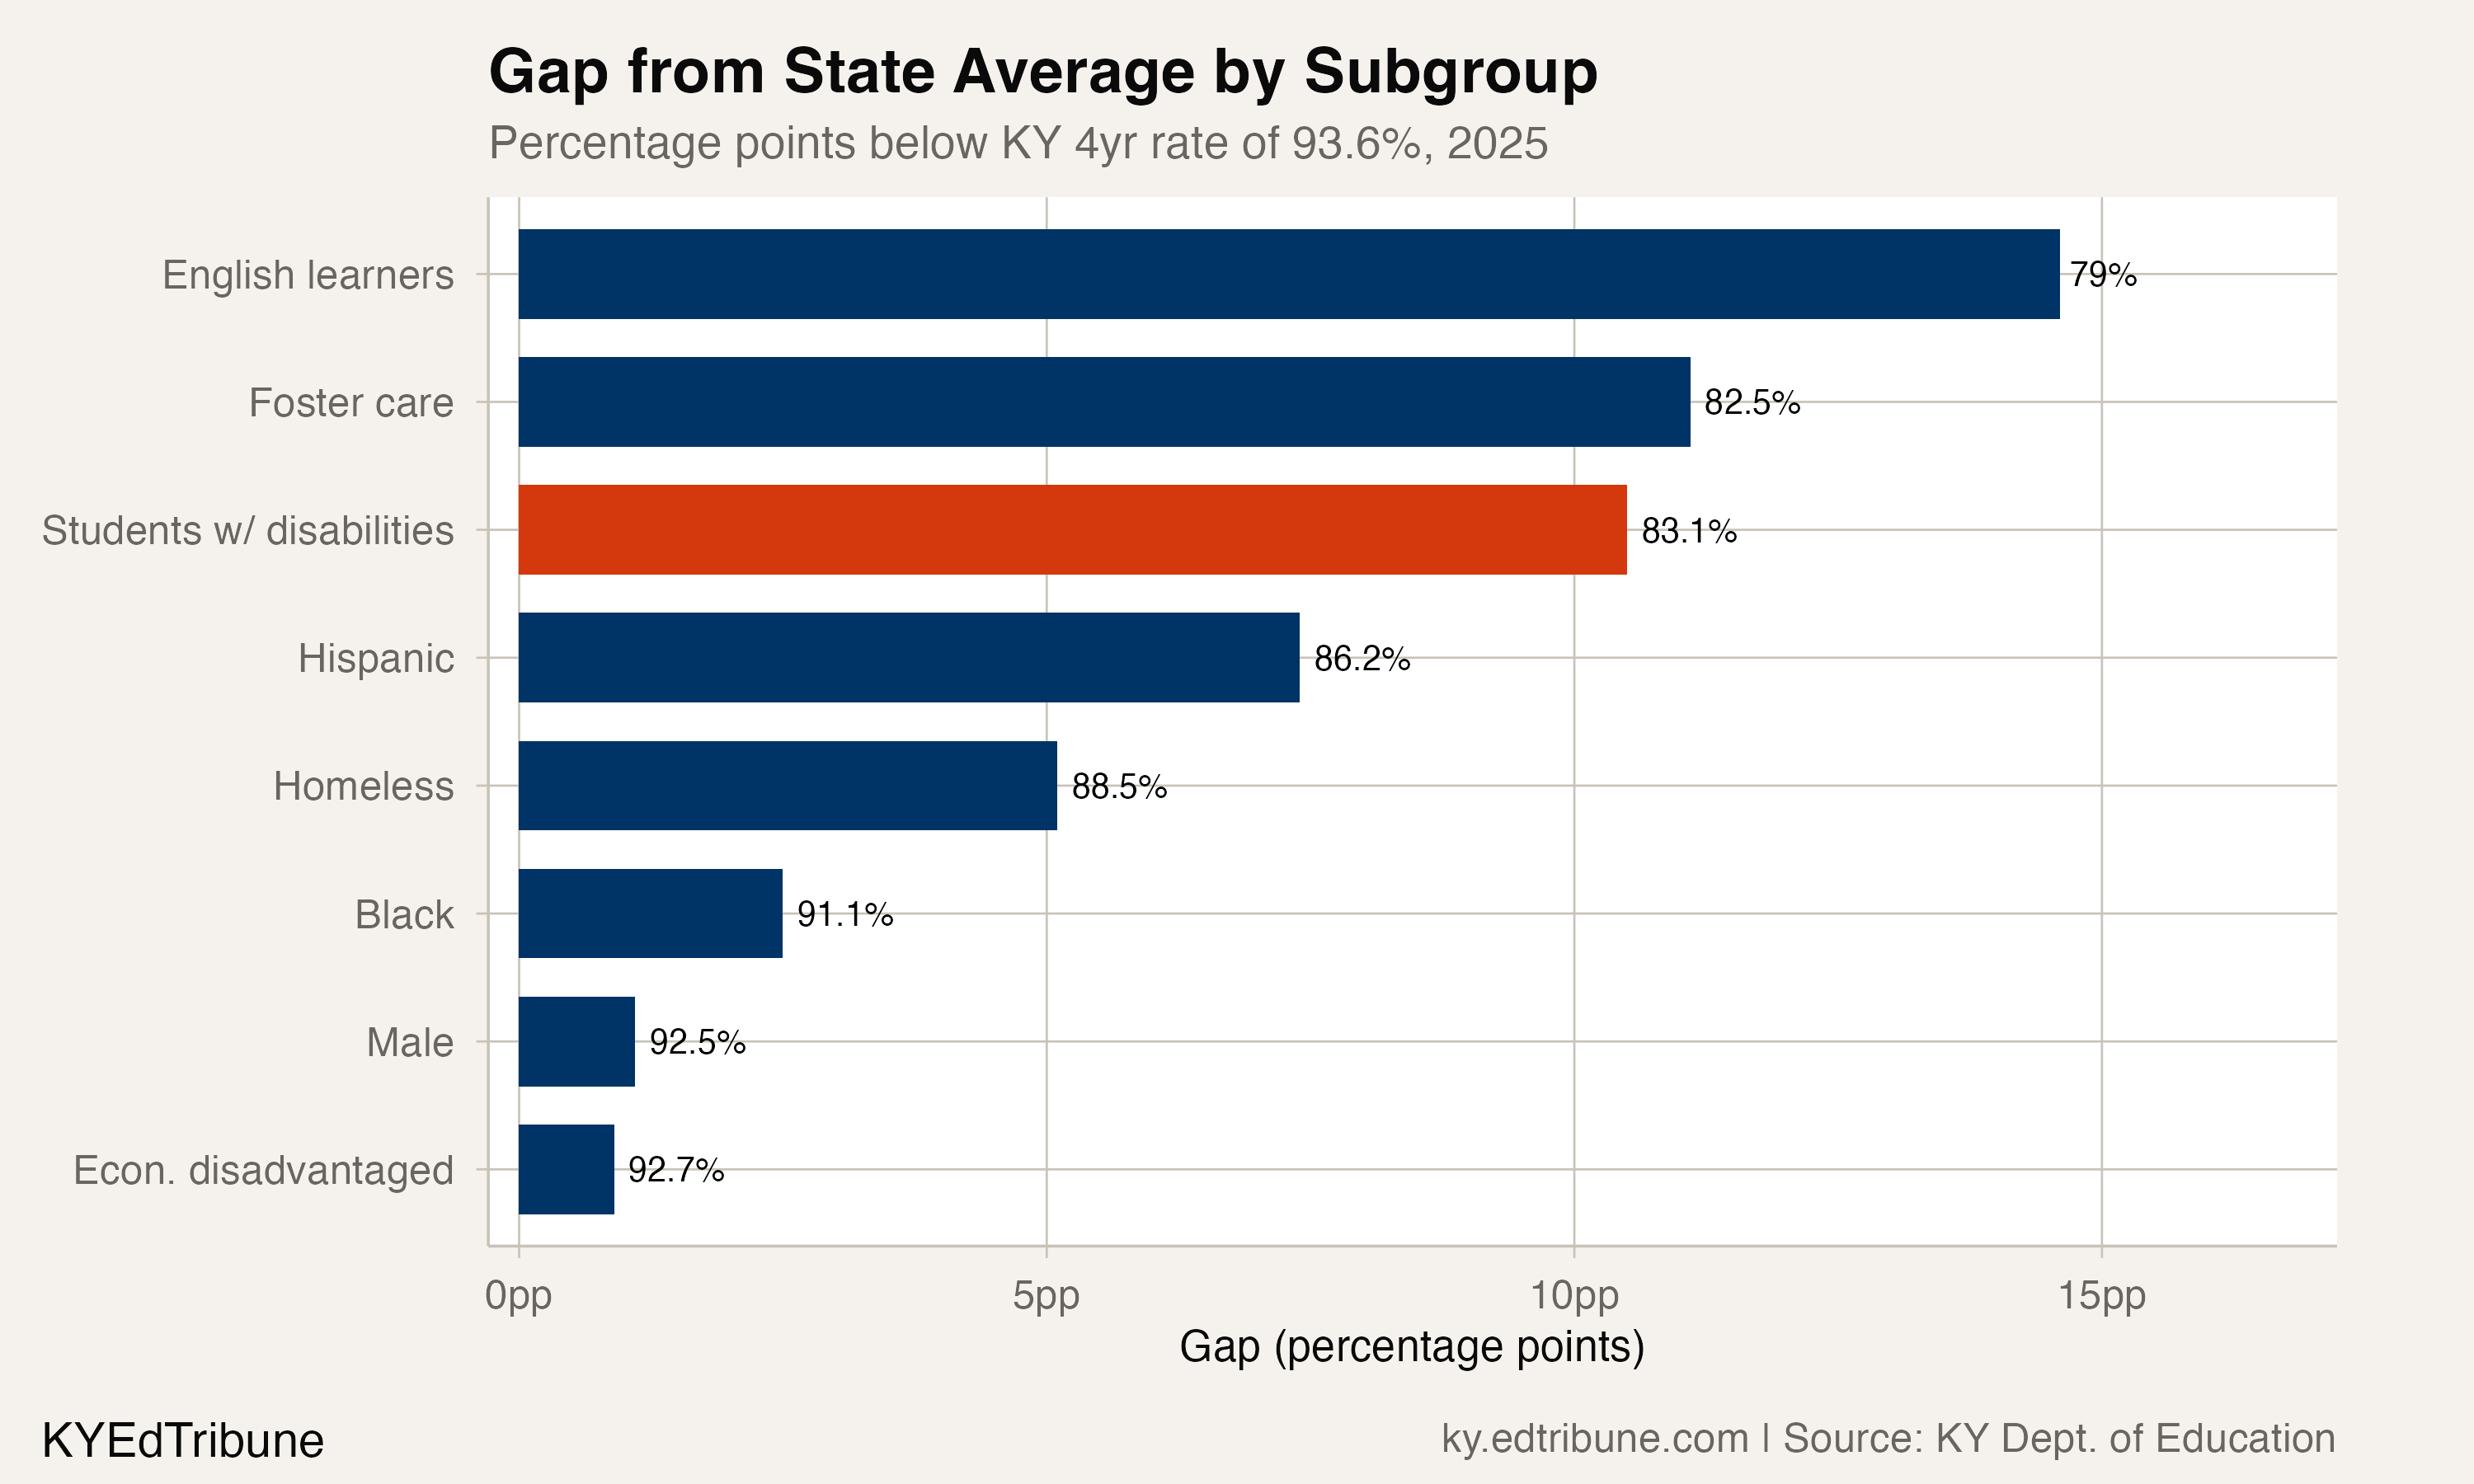
The pattern across subgroups is clear: Kentucky is compressing its graduation gaps broadly, not just for one population. Black students graduated at 91.1%, 2.5 points below the state average, a gap that would have been startling a decade ago. Homeless students reached 88.5%. The state's overall rate of 93.6% is itself a record high in the six-year dataset.
The gap is smaller, but not shrinking in a straight line
The SpEd-to-all gap fell sharply between 2020 and 2022, dropping from 13.1 points to 10.4. Then it stalled. In 2023-24, the gap actually widened to 11.3 points as the all-student rate climbed faster than the SpEd rate, which sat flat at 81.0% for two consecutive years. The 2024-25 data broke that plateau: the SpEd rate jumped 2.1 points in a single year, from 81.0% to 83.1%, the largest year-over-year gain in the dataset.
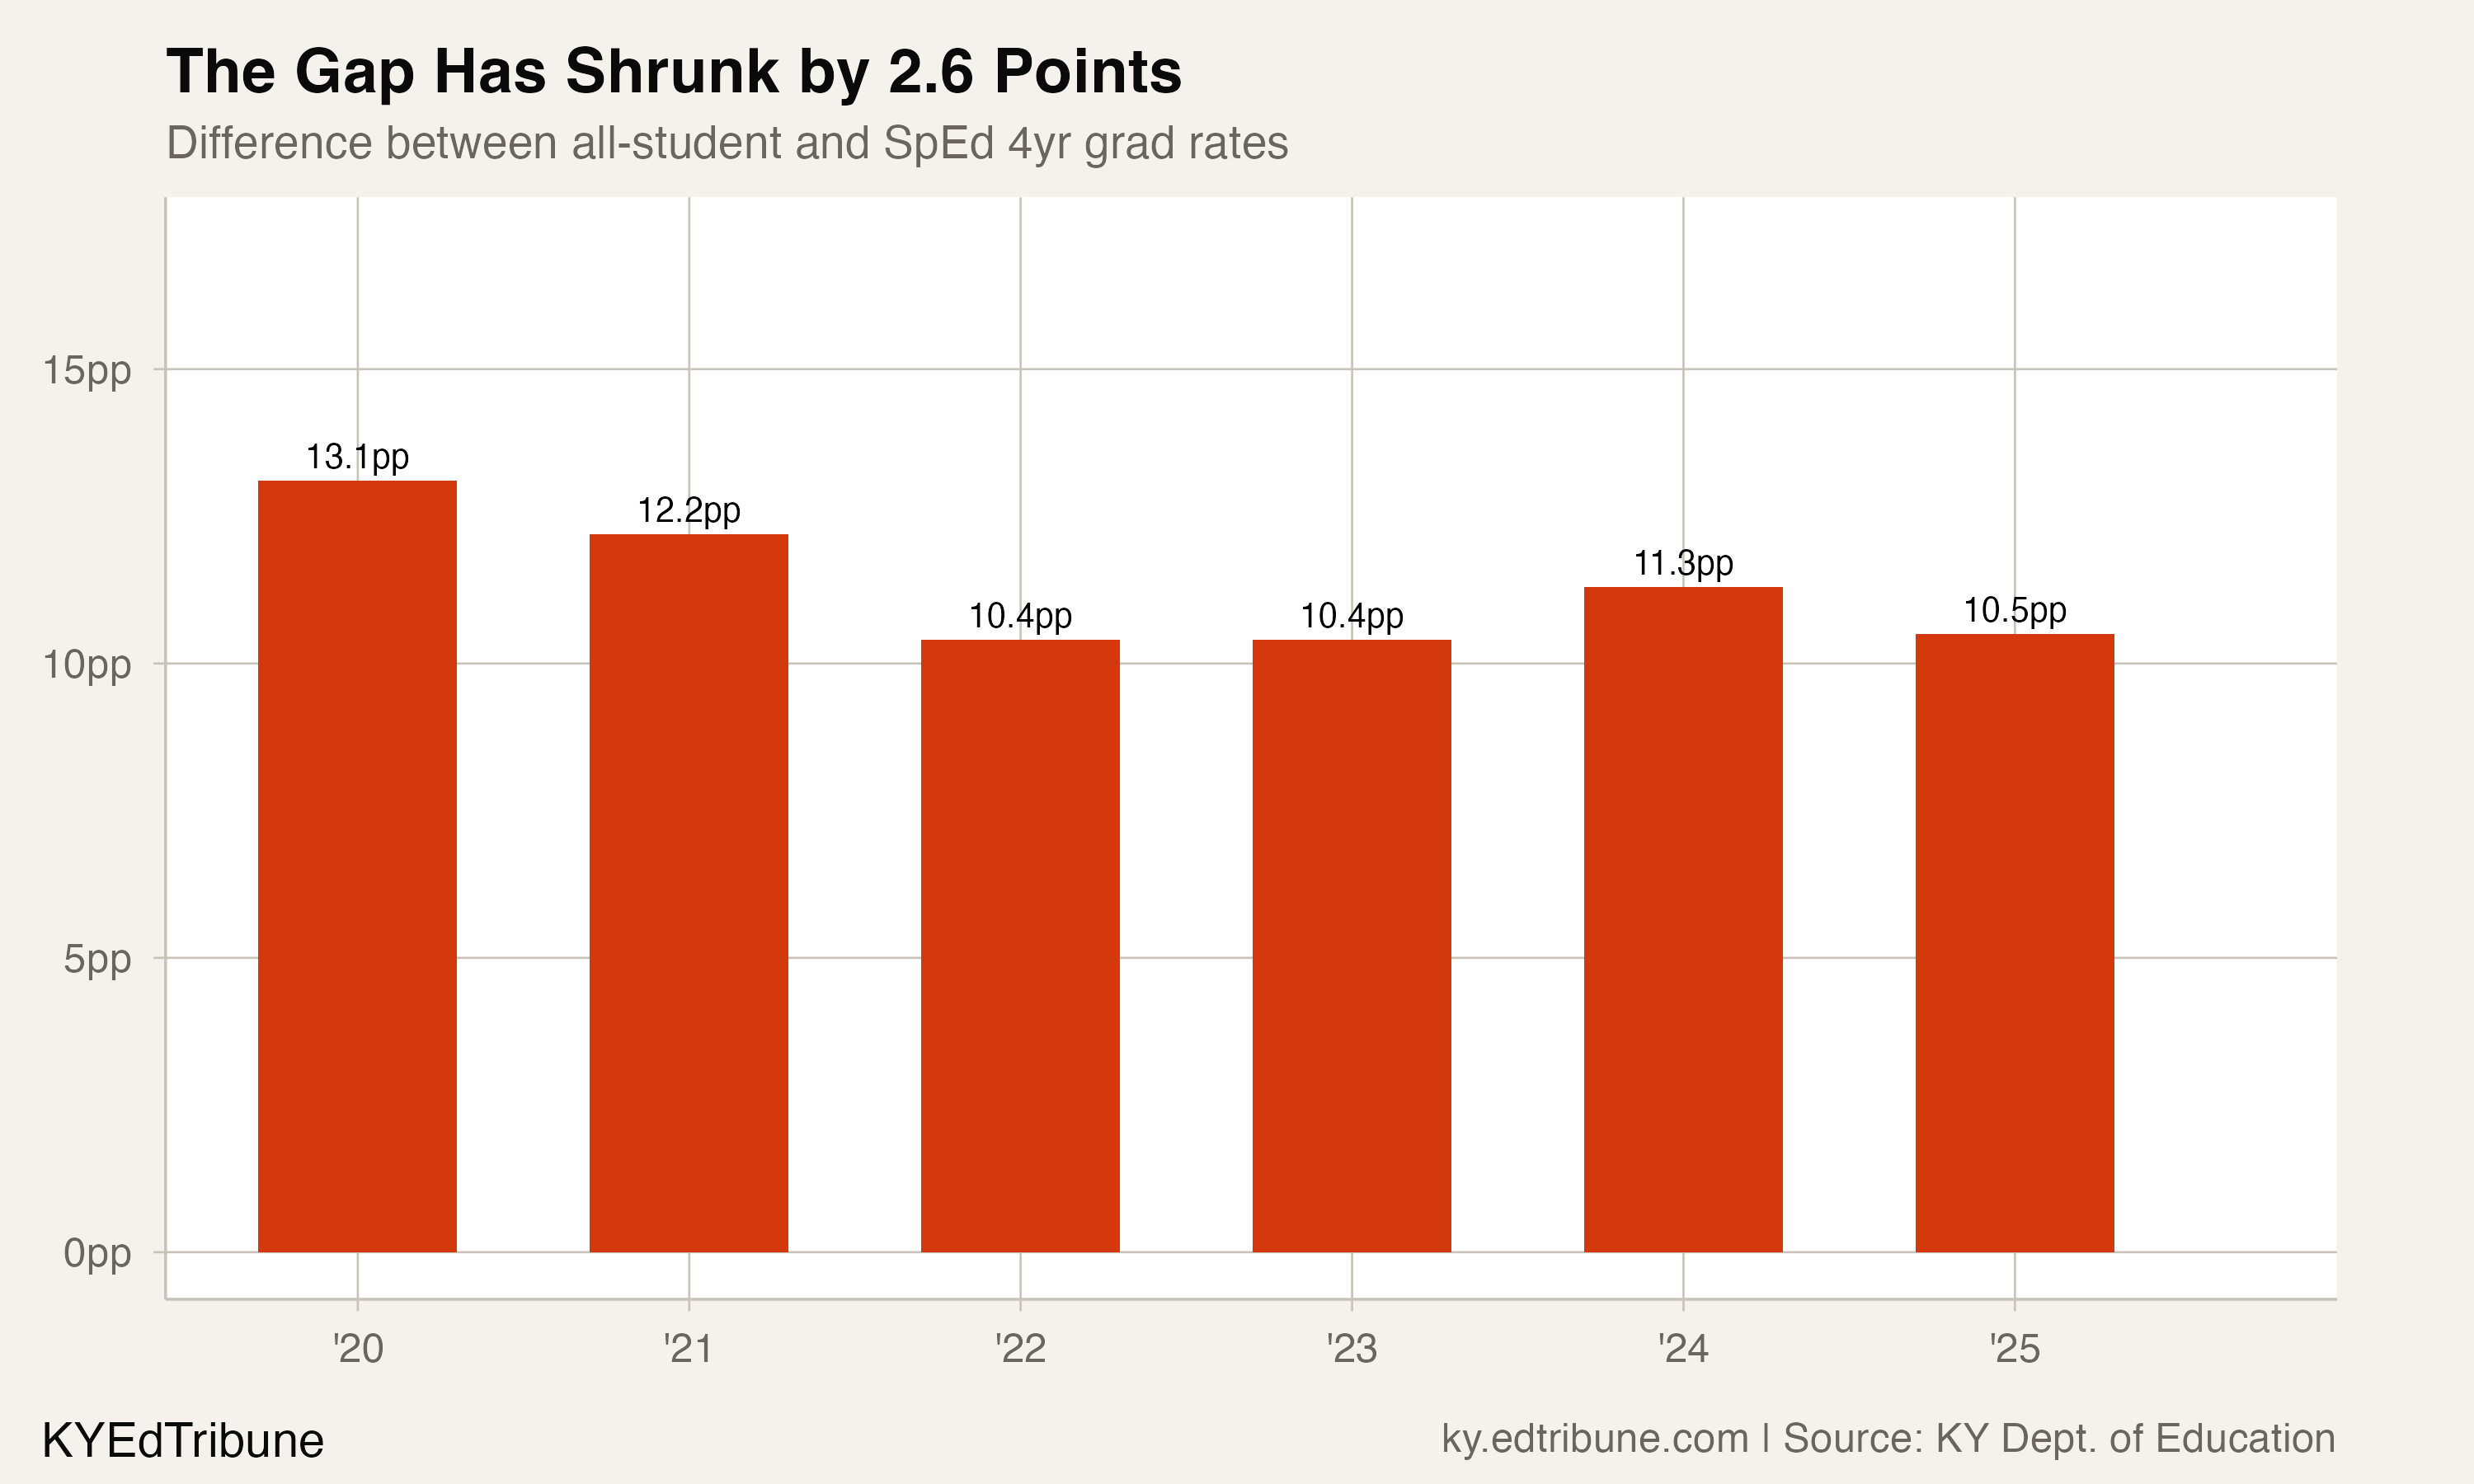
Whether the 2025 jump represents a durable shift or a one-year correction after two flat years is the question the next cohort will answer.
Louisville gained 11 points
The single most consequential move at the district level came from the state's largest district. Jefferson County Public Schools graduated 80.7% of students with disabilities in 2024-25, up from 69.7% in 2019-20, an 11-point gain. That trajectory matters disproportionately because JCPS enrolls roughly 13,600 students with disabilities, and students with the most complex needs have increased by more than 14% since 2020. JCPS improved the rate while the population it was serving grew and became more acute.
Fayette County, the state's second-largest district, followed a similar trajectory: 73.4% in 2020 to 85.8% in 2025, a 12.4-point gain, with a dip in 2024 (82.6%) that it more than recovered from.
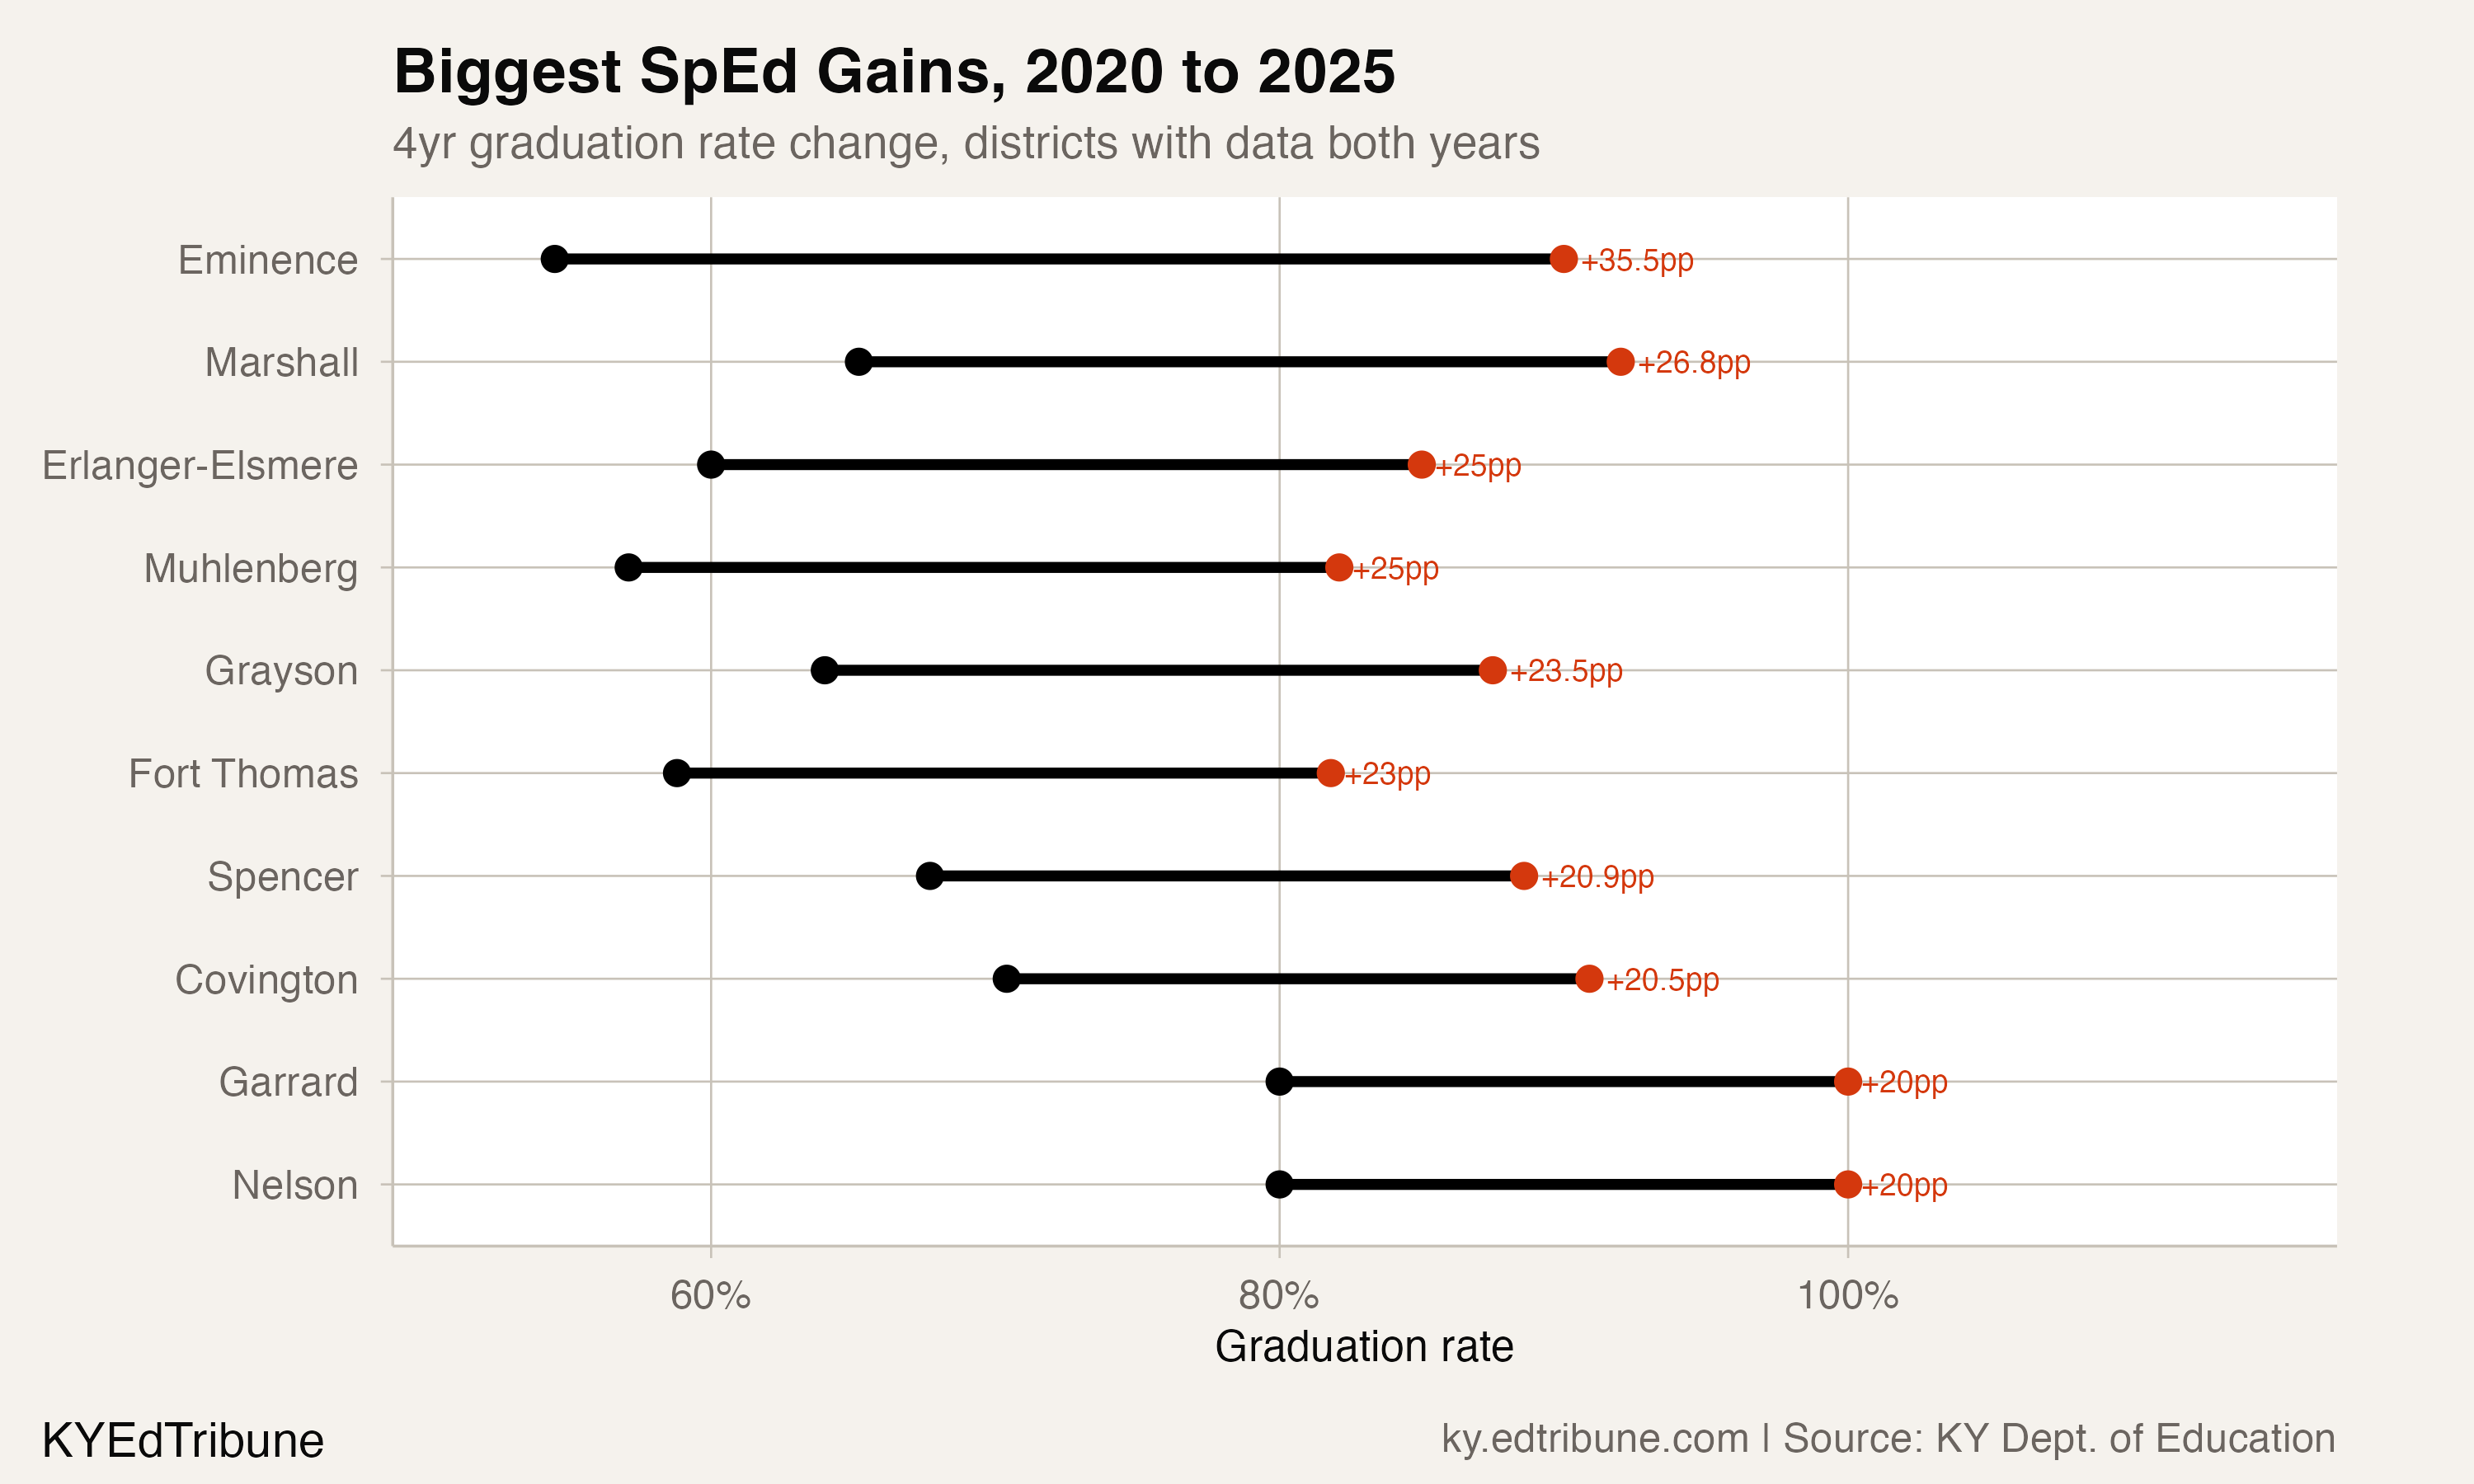
The biggest raw gains, though, came from smaller districts. Eminence Independent, a single-school district in Henry County, jumped from 54.5% to 90.0%, a 35.5-point swing. Marshall County gained 26.8 points. Erlanger-Elsmere Independent and Muhlenberg County each gained 25 points. These are districts where the SpEd cohort might be 15-30 students, so the rate is volatile. But the direction was overwhelmingly upward: of the 105 districts with SpEd data in both 2020 and 2025, the median change was positive.
The bottom end is still steep
The statewide distribution of SpEd graduation rates shows most districts above 80%, with a median of 84.4% across 126 reporting districts. But the tail is long. Caldwell County graduated 50% of its SpEd cohort. Russell County graduated 57.1%. Powell County, Knox County, and Bell County all fell below 70%.
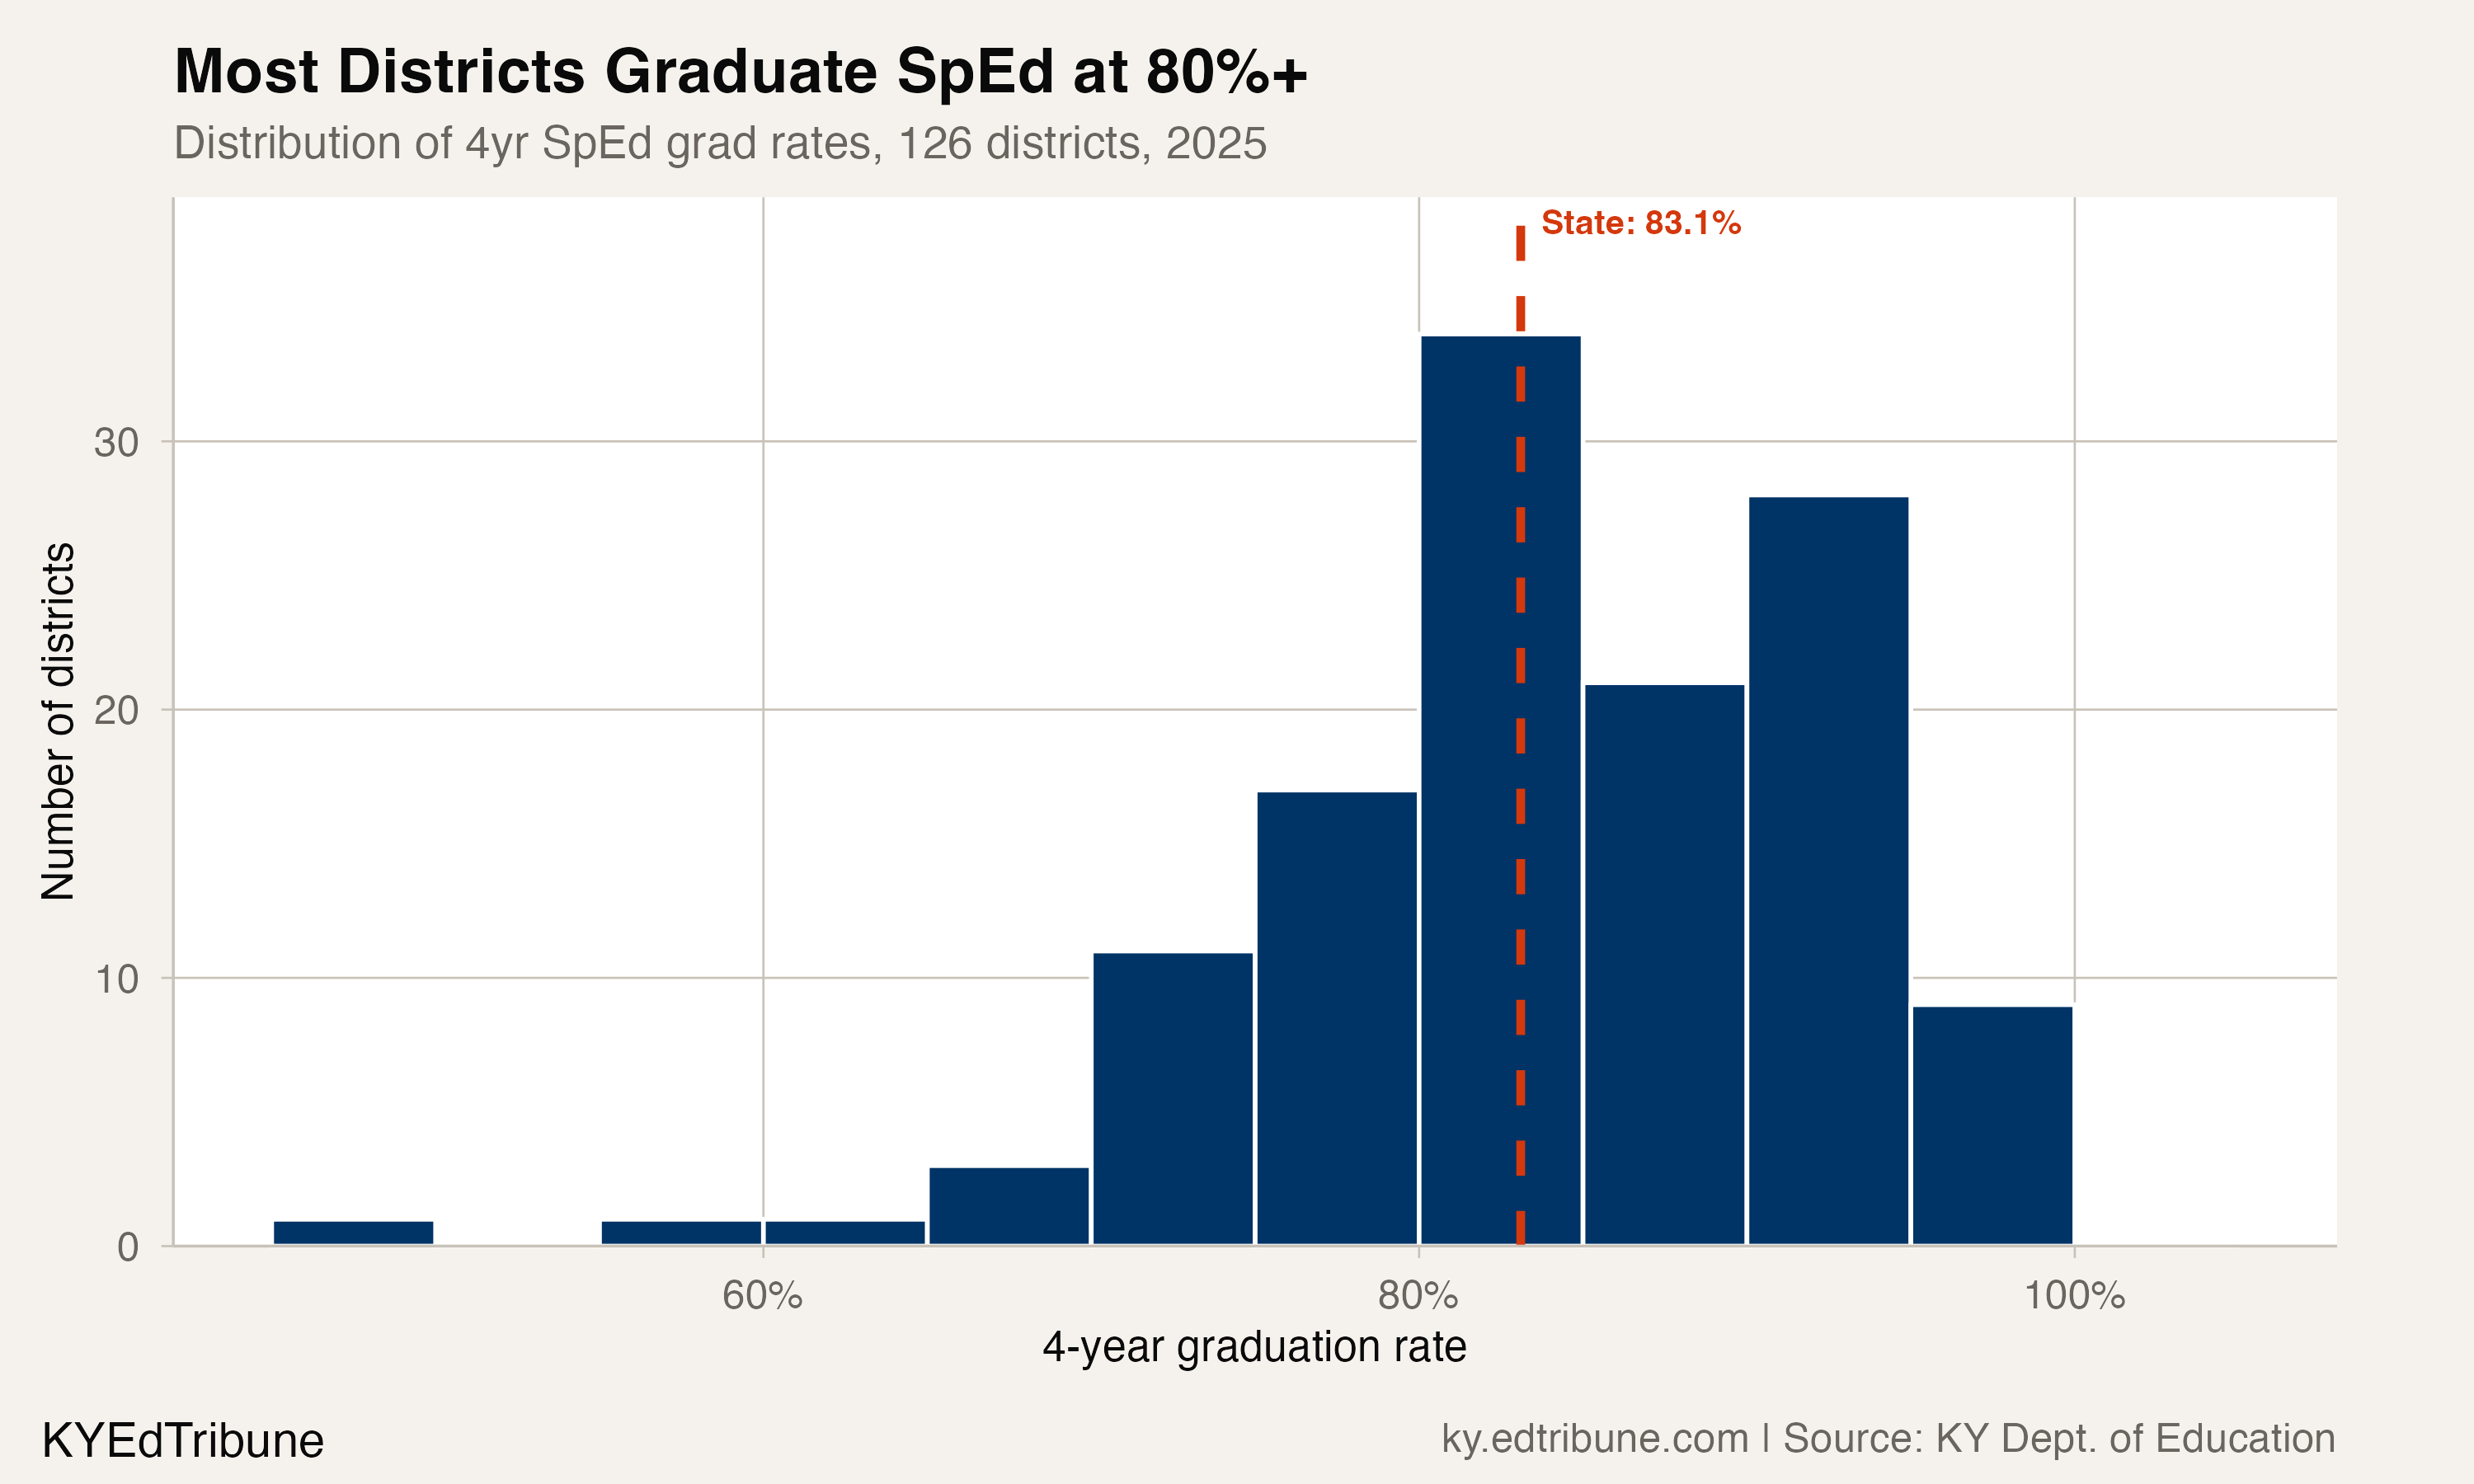
These low-rate districts are disproportionately concentrated in eastern Kentucky and the state's smaller rural systems. None of them appear in a vacuum: small cohort sizes mean a single student who does not complete can move the rate by 5-10 points. But a 50% rate, whatever the denominator, means half the students with disabilities who entered ninth grade four years ago did not earn a diploma.
The five-year rate tells a different story
Kentucky also tracks five-year graduation rates, which give students with disabilities an extra year to complete requirements. In 2024-25, the five-year SpEd rate was 83.5%, barely above the four-year rate of 83.1%. That near-convergence is unusual. In 2020, the five-year rate was 79.3% versus the four-year rate of 78.0%, a 1.3-point buffer. By 2024, the buffer had widened to 2.7 points (83.7% versus 81.0%).
The 2025 compression suggests that the gains are happening within the standard four-year window, not because more students are finishing in a fifth year. Students with disabilities are increasingly graduating on time rather than needing the extension.
What this does not explain
The data show the rate rising. They do not show why. Several plausible mechanisms exist, and the honest answer is that Kentucky's improvement likely reflects a combination of them rather than any single intervention.
Increased inclusion, placing students with disabilities in general education classrooms for a larger share of the school day, is the most commonly cited factor in special education outcomes research. JCPS has made this an explicit board priority, with its board discussing least-restrictive-environment placement as a key compliance indicator.
It is also possible that identification practices have shifted. If districts are identifying a broader population of students as qualifying for IEPs, including students with milder disabilities who were always likely to graduate, the rate would rise without any change in instruction. The statewide SpEd population has grown, but the data do not separate identification-driven growth from genuine arrival-driven growth.
Finally, the pandemic-era grading and credit-recovery flexibility that many states adopted between 2020 and 2022 may have embedded itself into ongoing practice. Kentucky's statewide graduation rate rose 3.5 points between 2022 and 2025 for all students. The SpEd rate rose 3.4 points over the same span. Whether both gains reflect improved outcomes or changed standards is a question the graduation rate alone cannot answer.
The board meeting nobody talks about
The next test for Kentucky's SpEd graduation system is not the 2025-26 cohort. It is the growing caseload. If JCPS's 14% increase in students with complex needs is replicated even partially across the state, districts will face the question of whether the practices that produced an 83.1% rate can scale to a larger, more acute population.
At the state level, Kentucky's 10.5-point SpEd gap would be unremarkable if the baseline were 75%. It is remarkable because the baseline is 93.6%. Getting students with disabilities to within 10.5 points of a rate that high, and doing it while the all-student rate is also climbing, is a structural achievement. Whether the next five years look like the last five, or whether the rate plateaus again as it did in 2023-24, will depend on decisions being made in district-level IEP meetings and state-level funding formulas right now.
Detailed code that reproduces the analysis and figures in this article is available exclusively to EdTribune subscribers.
Discussion
Sign in to join the discussion.
Loading comments...