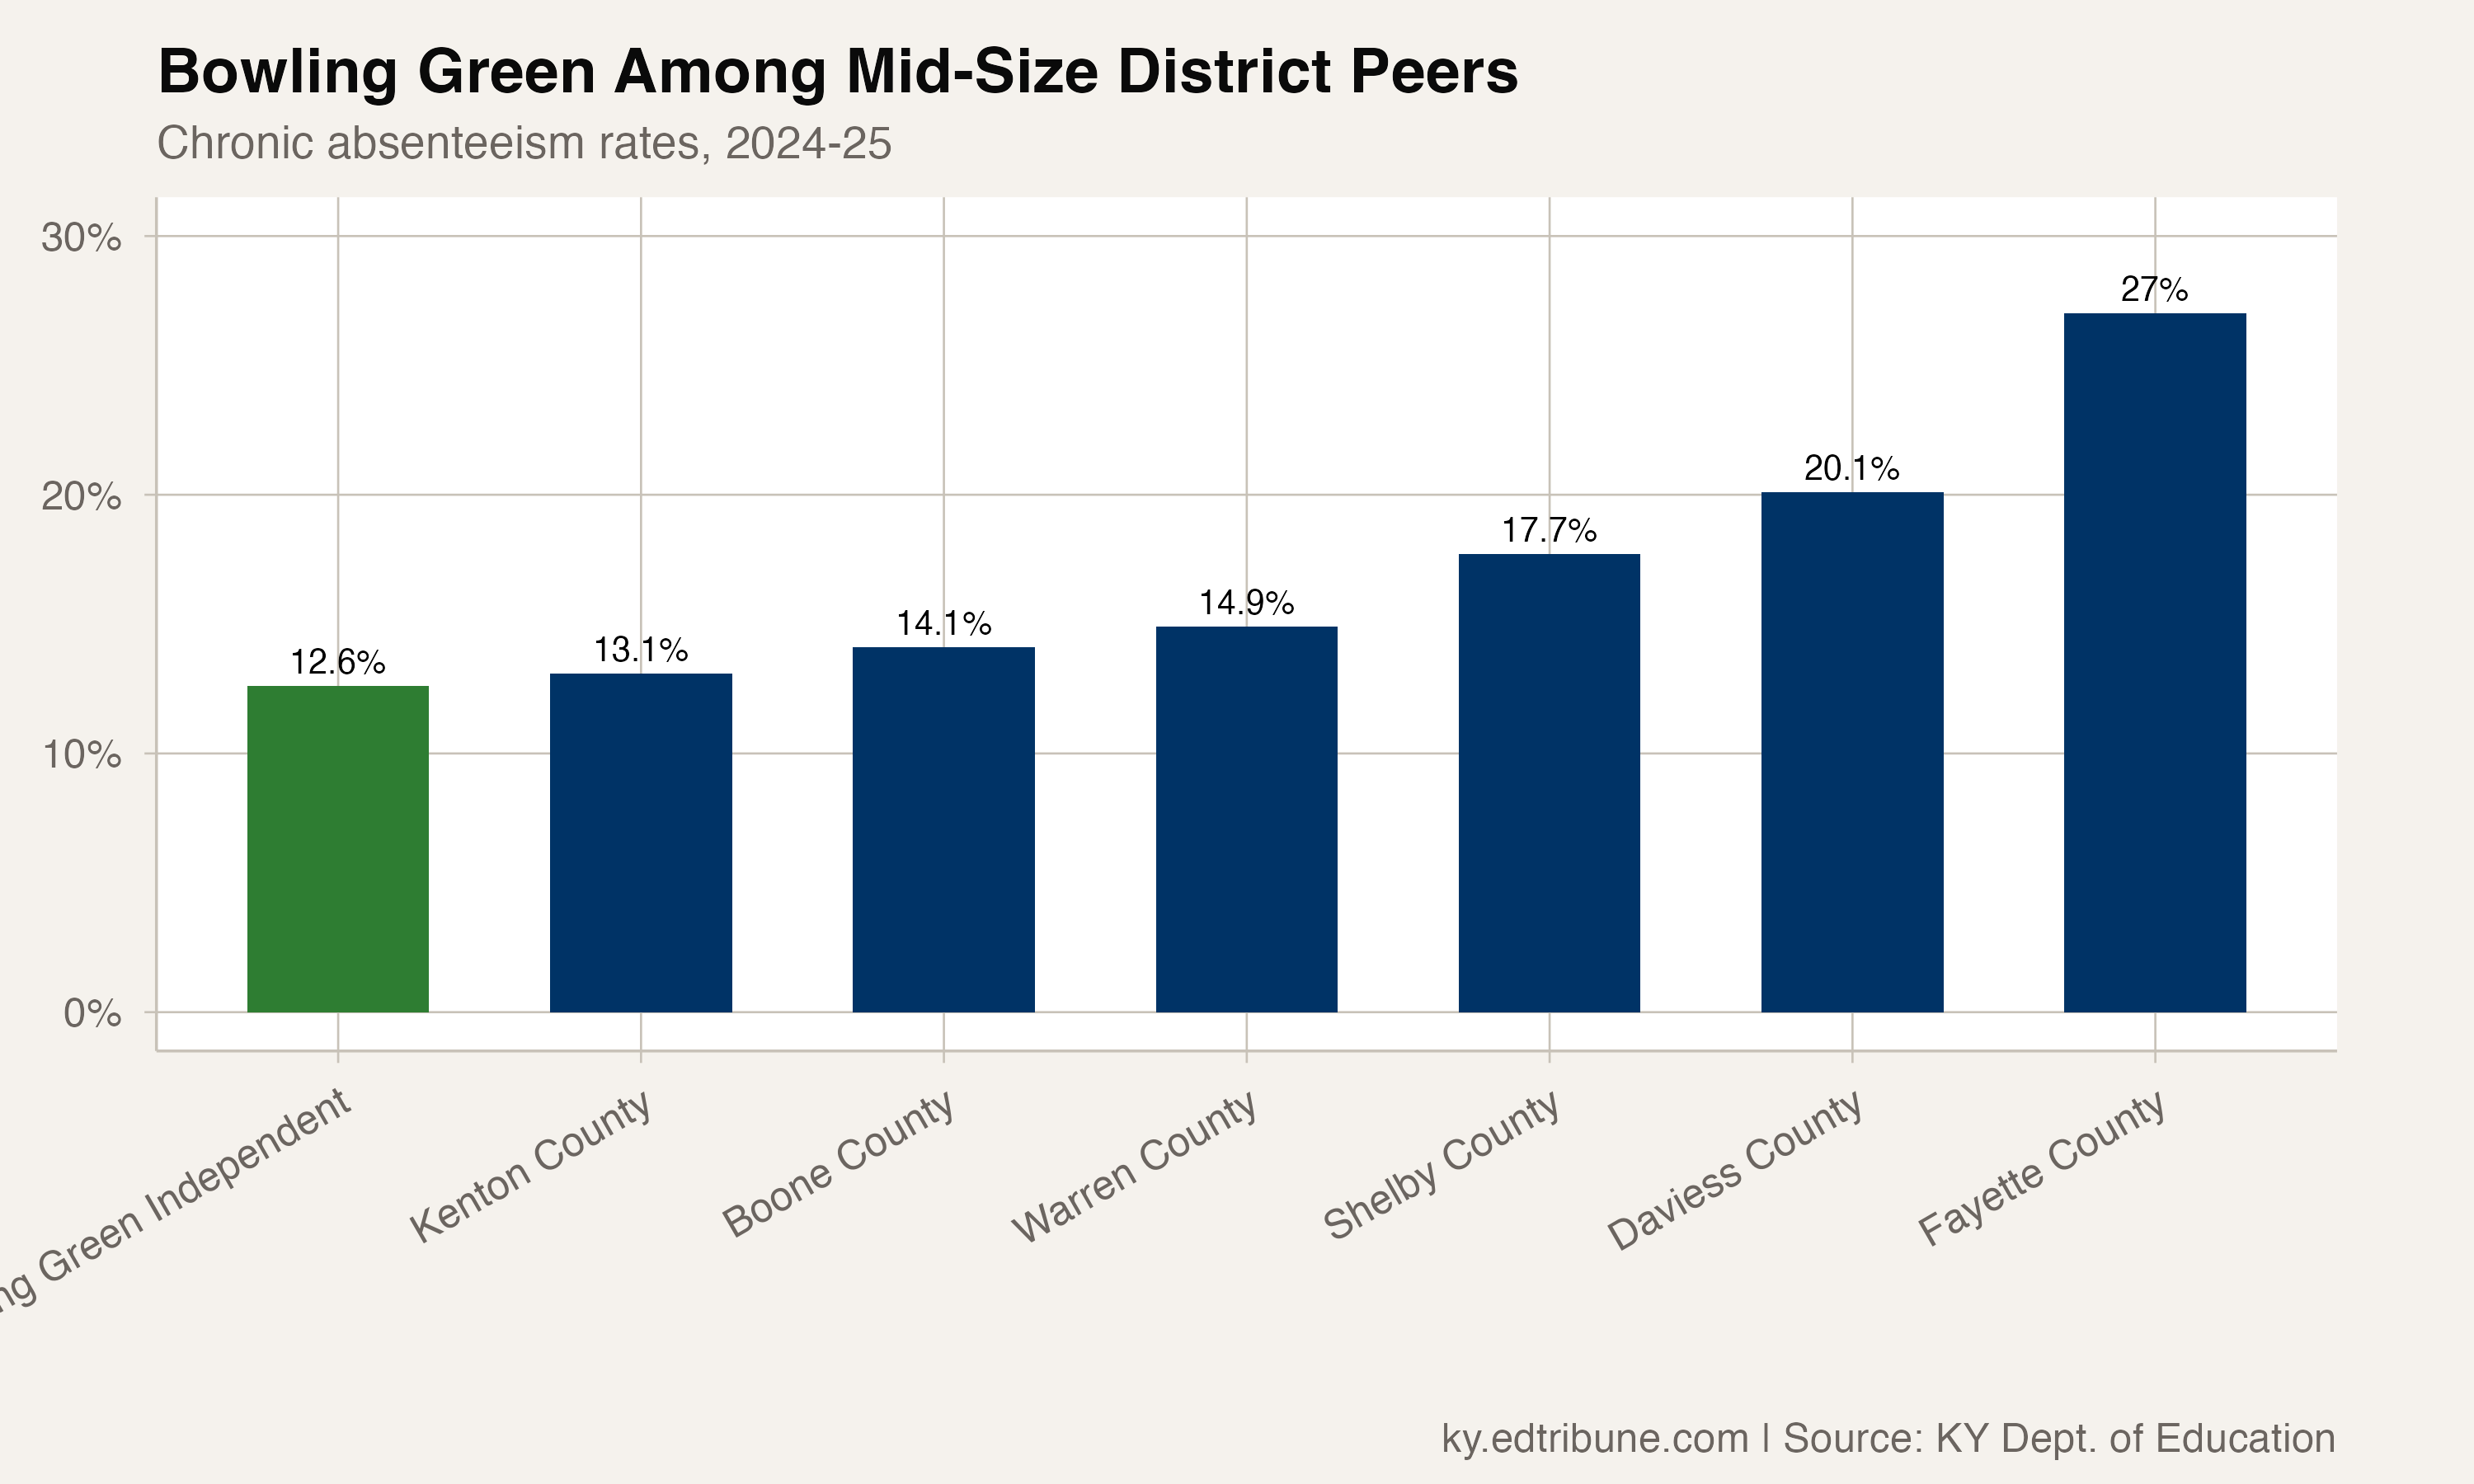
Bowling Green Independent is a district where 22% of students are English learners, 67% are economically disadvantaged, and the student body includes refugees from more than a dozen countries. It is not the kind of district that typically leads attendance rankings. Its chronic absenteeism rate is 12.6%.
That is less than half Kentucky's 25.0% statewide rate. It is lower than Oldham County (11.0%), the state's wealthiest large district, which has roughly twice the enrollment and a fraction of the demographic complexity. It is lower than virtually every district in the state with comparable diversity.
A trend, not a fluke
Bowling Green's chronic rate has dropped steadily: 15.9% in 2022-23, 12.9% in 2023-24, 12.6% in 2024-25. The improvement is modest in absolute terms -- 3.3 points over two years -- because the district started from a much lower baseline than the state. When you are already good, getting better is harder.
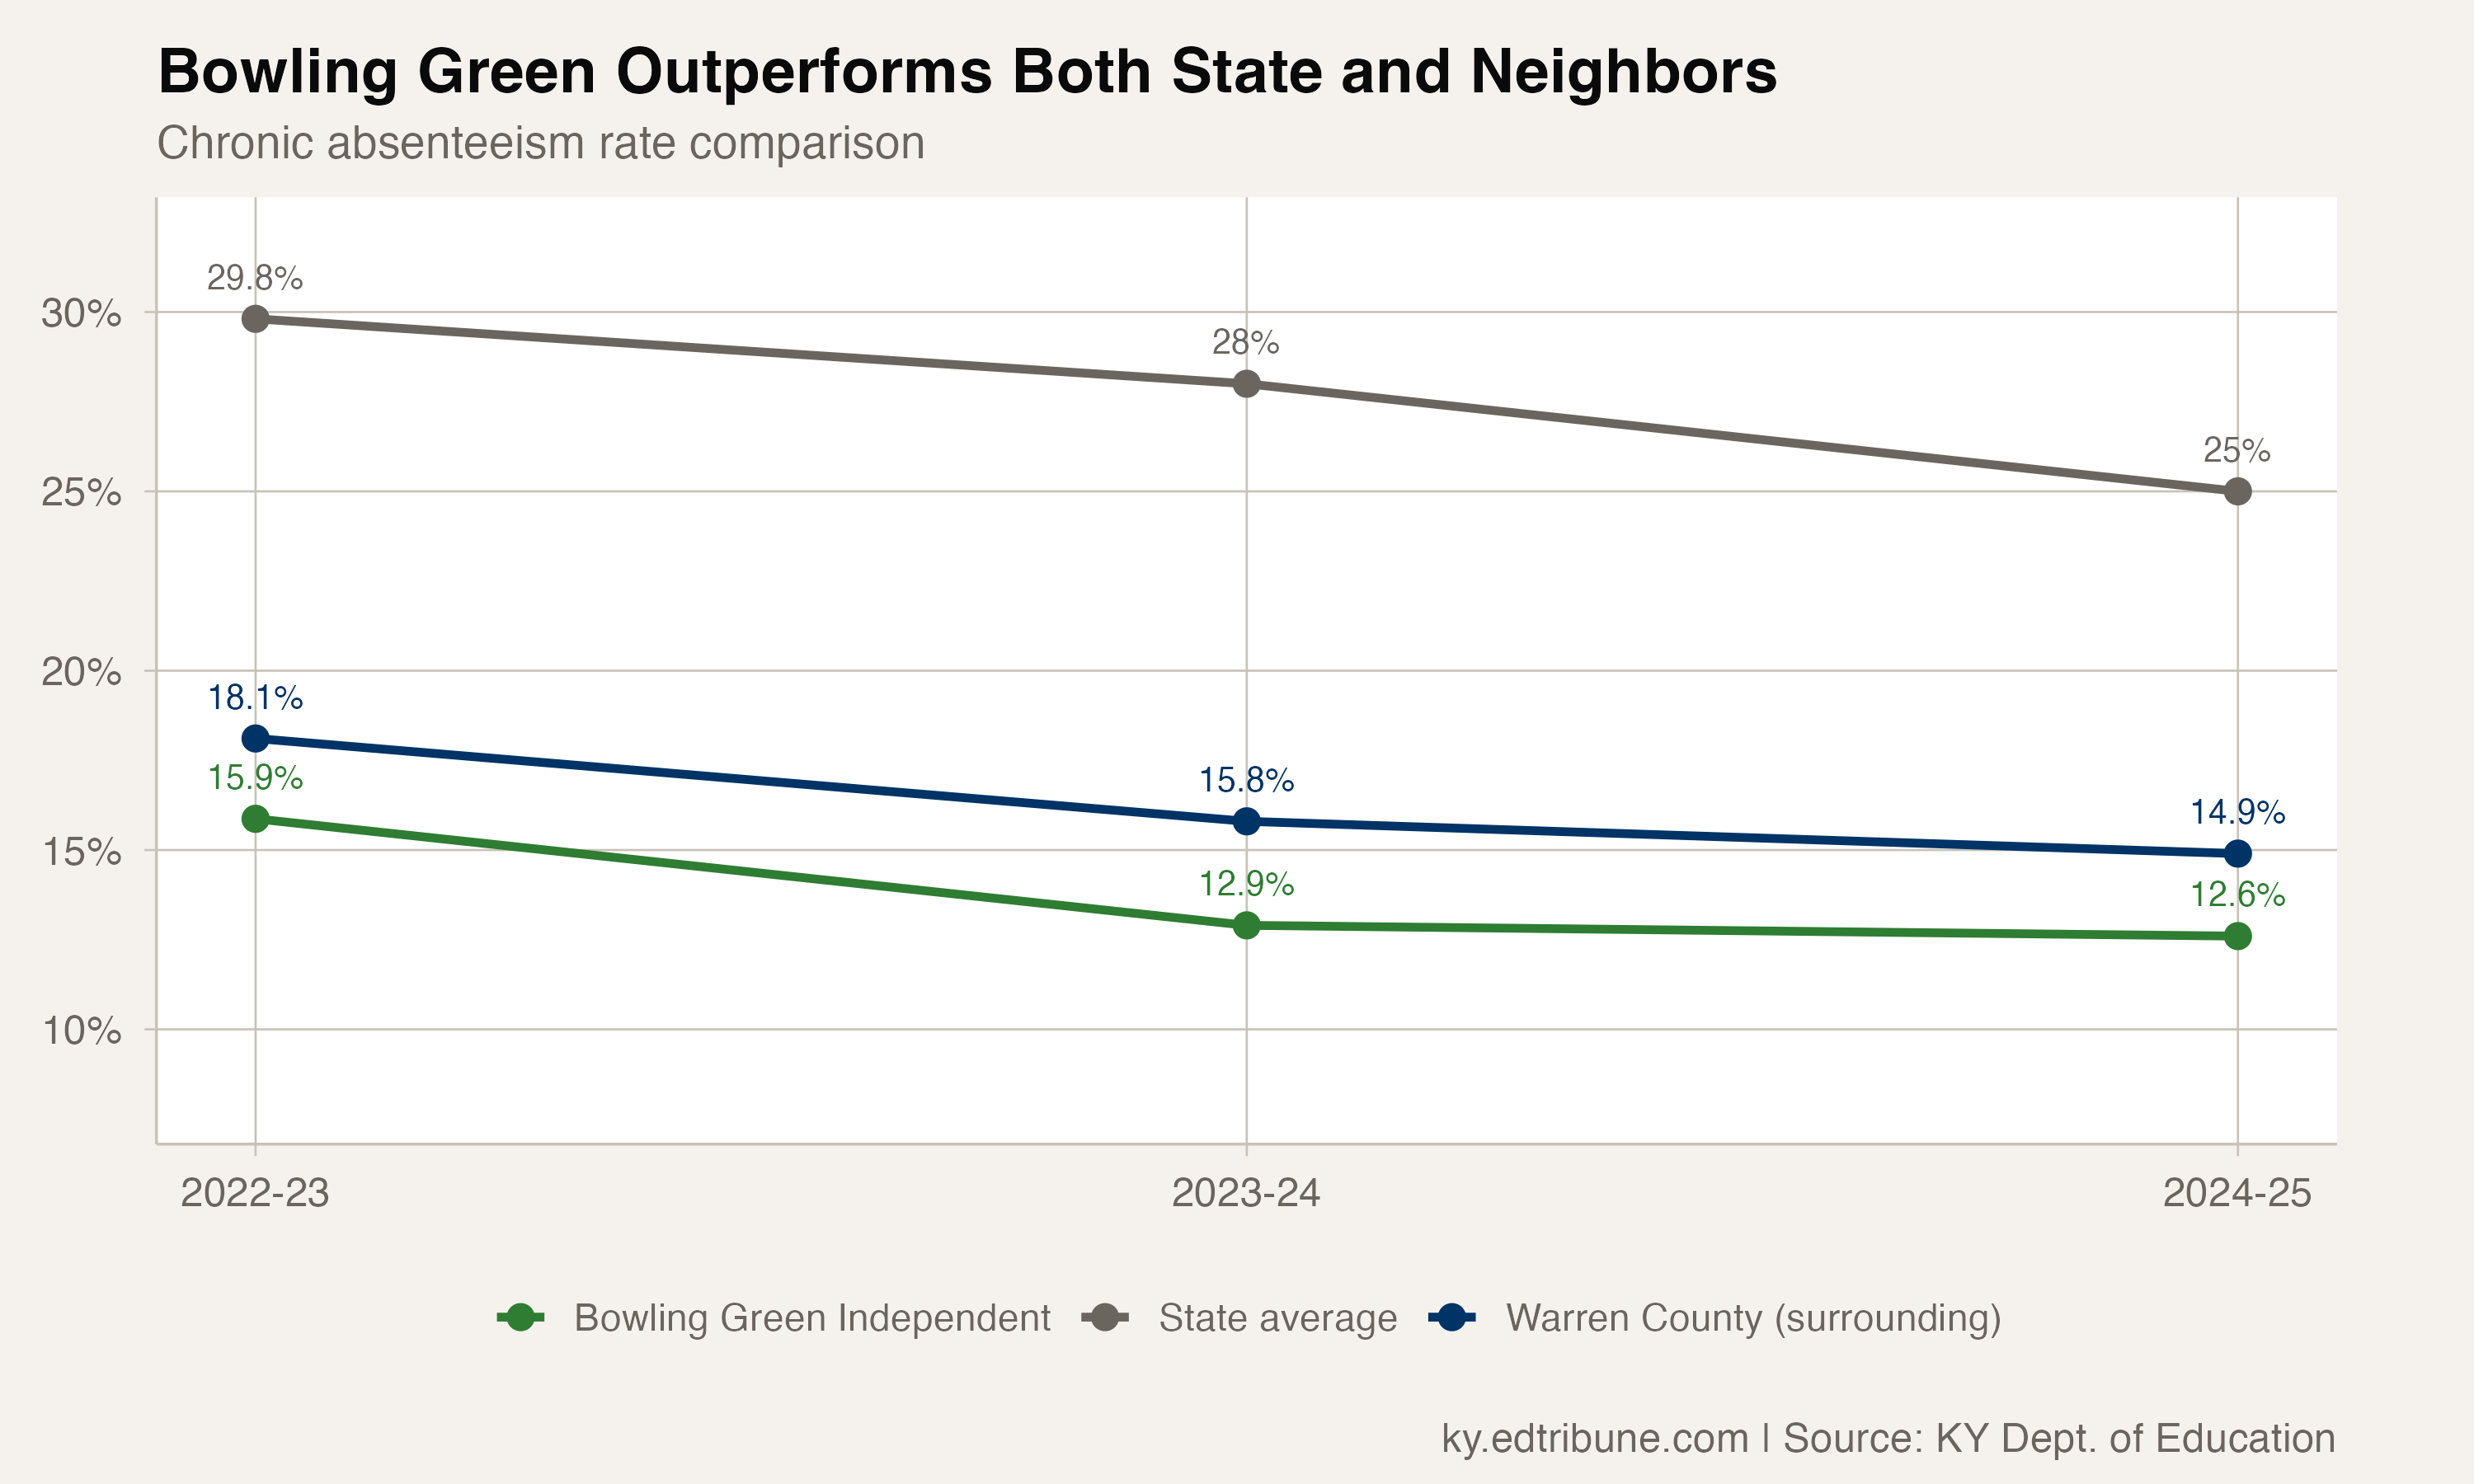
Warren County, the surrounding district with 19,337 students, sits at 15.8% -- also well below the state average but 3.2 points above Bowling Green. The city district outperforms the suburban district, a reversal of the usual pattern where smaller, denser urban systems face greater attendance challenges.
The subgroup story is the real story
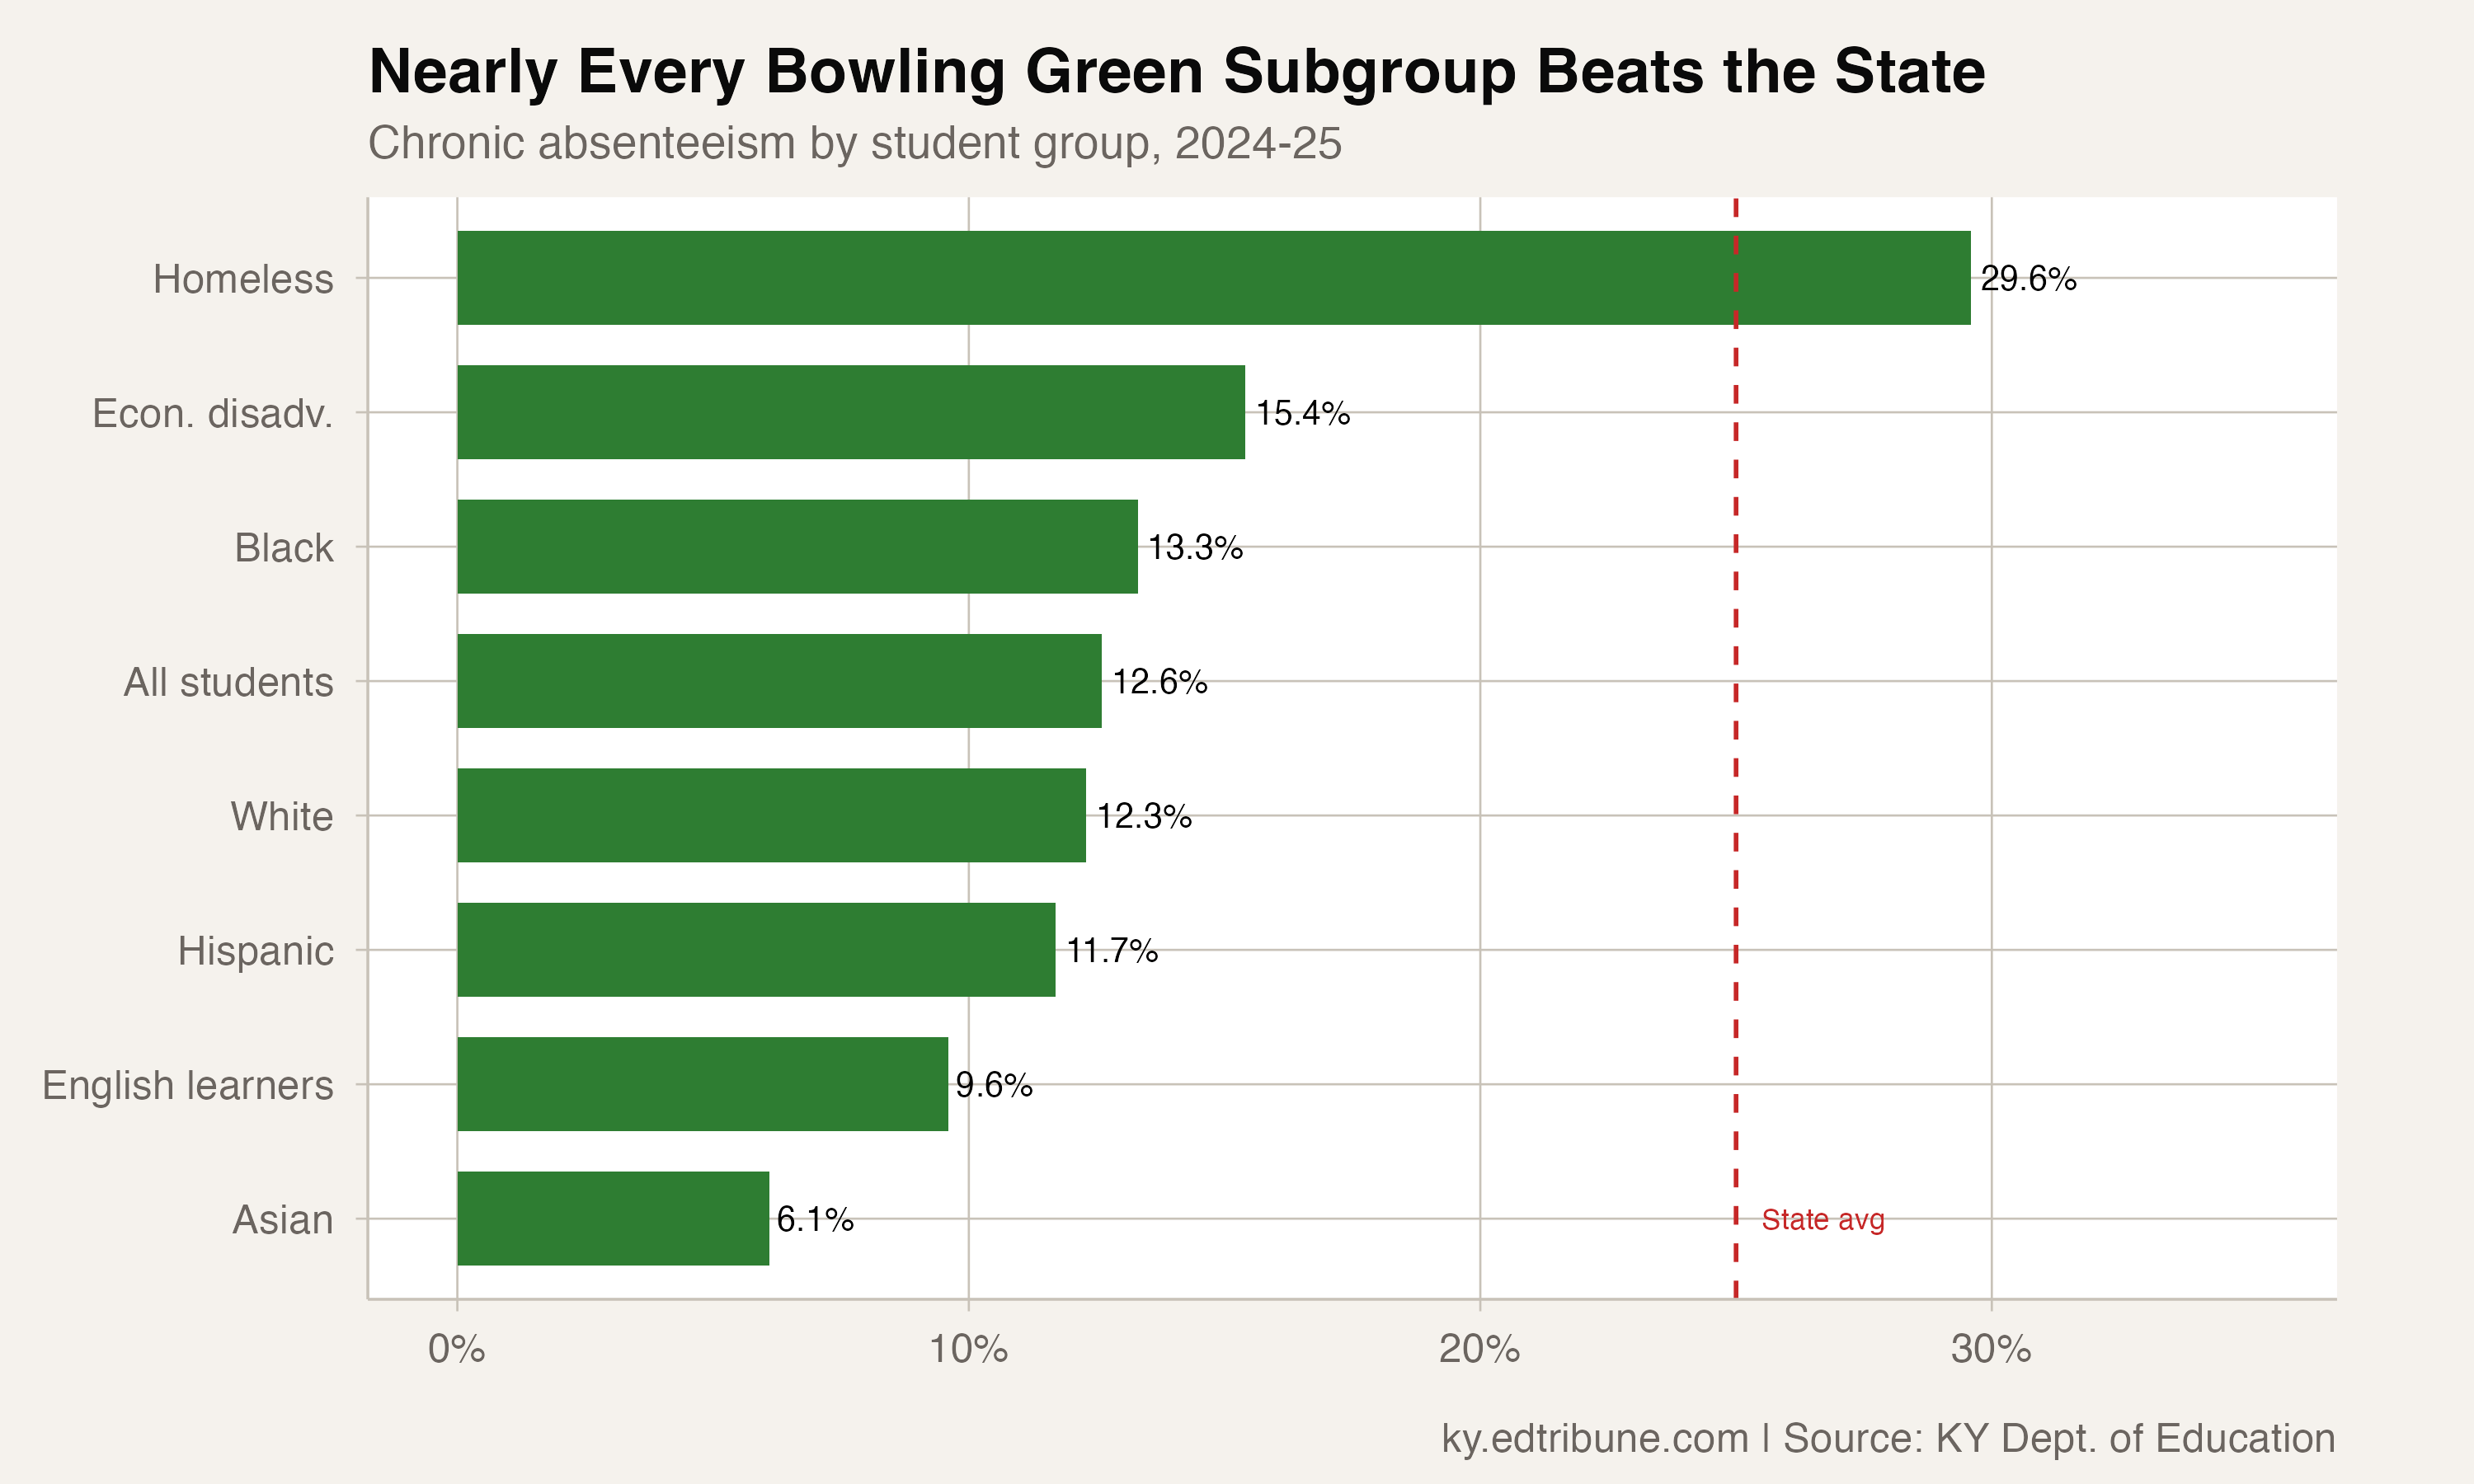
What makes Bowling Green's performance exceptional is not the headline number but the consistency across subgroups. Black students: 13.3%. Hispanic students: 11.7%. English learners: 9.6%. Economically disadvantaged students: 15.4%. In most districts, each of those groups would be well above the state average. In Bowling Green, none is.
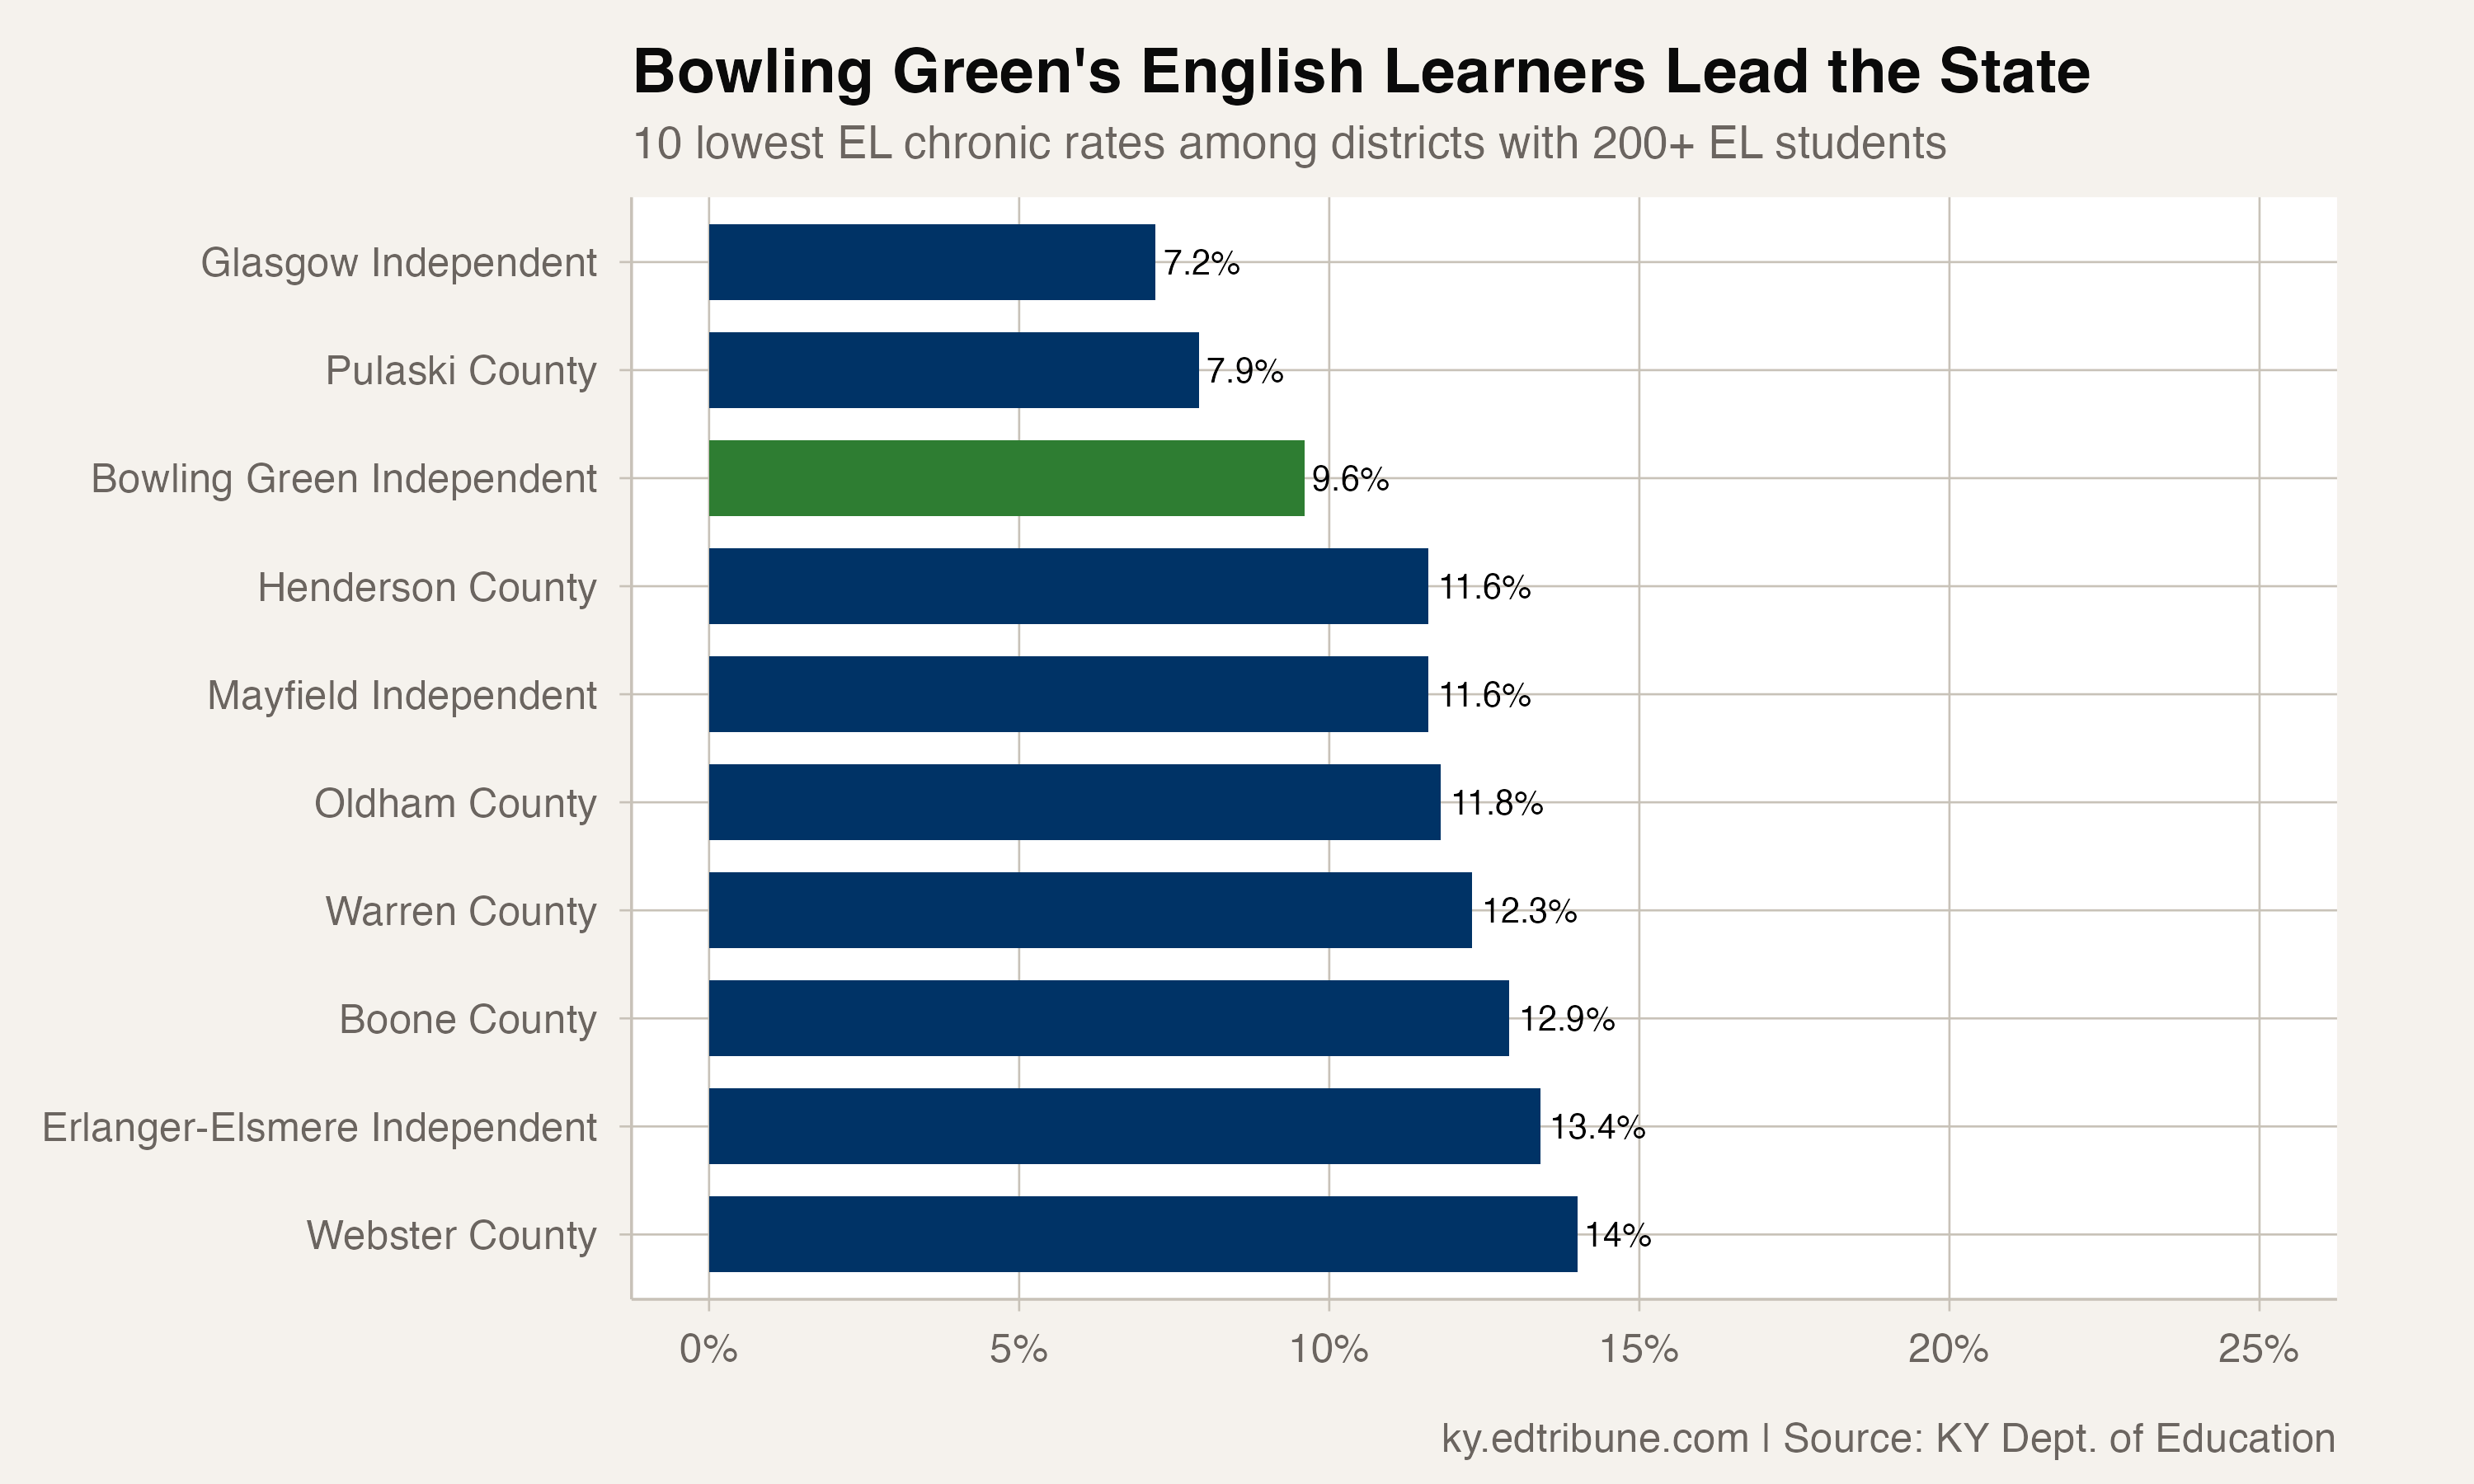
The English learner number deserves particular attention. Bowling Green's 1,165 EL students have a 9.6% chronic rate -- lower than the district's overall rate and dramatically lower than the state average for EL students (22.7%). Nationally, English learners typically have higher chronic absenteeism, not lower. Bowling Green's reversal of this pattern, in a district with a substantial refugee population, suggests something about how the district connects with immigrant families.
Homeless students are the one subgroup where Bowling Green's rate climbs to 29.6%, above the district average but still well below the statewide homeless rate of 42.7%.
Small enough to know every family
Bowling Green sits at the intersection of several factors that could contribute to strong attendance. The International Center of Kentucky, which coordinates refugee resettlement, has deep ties to the school district and the families it serves. The district is small enough (5,229 students) that individual outreach is feasible in ways that may not scale to JCPS's 98,000. The refugee communities that drive Bowling Green's diversity often bring strong cultural values around education, though attributing attendance to cultural factors without direct evidence risks oversimplification.
The district's size matters. At 5,229 students, Bowling Green is large enough to have real demographic complexity but small enough that a single initiative -- a bilingual attendance coordinator, a partnership with a resettlement agency, a principal who knows every family -- can move the entire district's numbers. Whether Bowling Green's approach is replicable in a district five or twenty times its size is the question that the data raises but cannot answer.
"Bowling Green demonstrates that diversity is not a barrier to attendance. The district's refugee families and English learner population are among the most consistent attendees." -- Kentucky Department of Education, District Attendance Report, 2025
The excuse that Bowling Green takes away
Every superintendent running a high-poverty, high-diversity district with a 35% chronic rate has a ready explanation: demographics. Bowling Green has 67% economically disadvantaged students, 22% English learners, refugees from a dozen countries, and a 12.6% rate. The explanation does not survive contact with Bowling Green's numbers.
Something about a 5,229-student district where the International Center of Kentucky helps families navigate enrollment, where a bilingual coordinator might know a Somali mother by name, where the distance between a missed bus and a phone call from the front office is measured in minutes -- something about that produces attendance numbers that JCPS's 4.5 million text messages cannot match. Bowling Green is small enough that its model may not transfer. It is real enough that its existence changes the conversation.
Detailed code that reproduces the analysis and figures in this article is available exclusively to EdTribune subscribers.
Discussion
Sign in to join the discussion.
Loading comments...