Fort Thomas Independent, a Northern Kentucky district of 3,145 students, recorded a 5.9% chronic absenteeism rate in 2024-25. Harlan County, an Appalachian district of 3,367, recorded 51.6%. Both hit their best mark in the three years Kentucky has tracked the data. The gap between them is a chasm -- 45.7 percentage points separating the state's attendance champion from its most challenged large district -- but both are moving in the same direction.
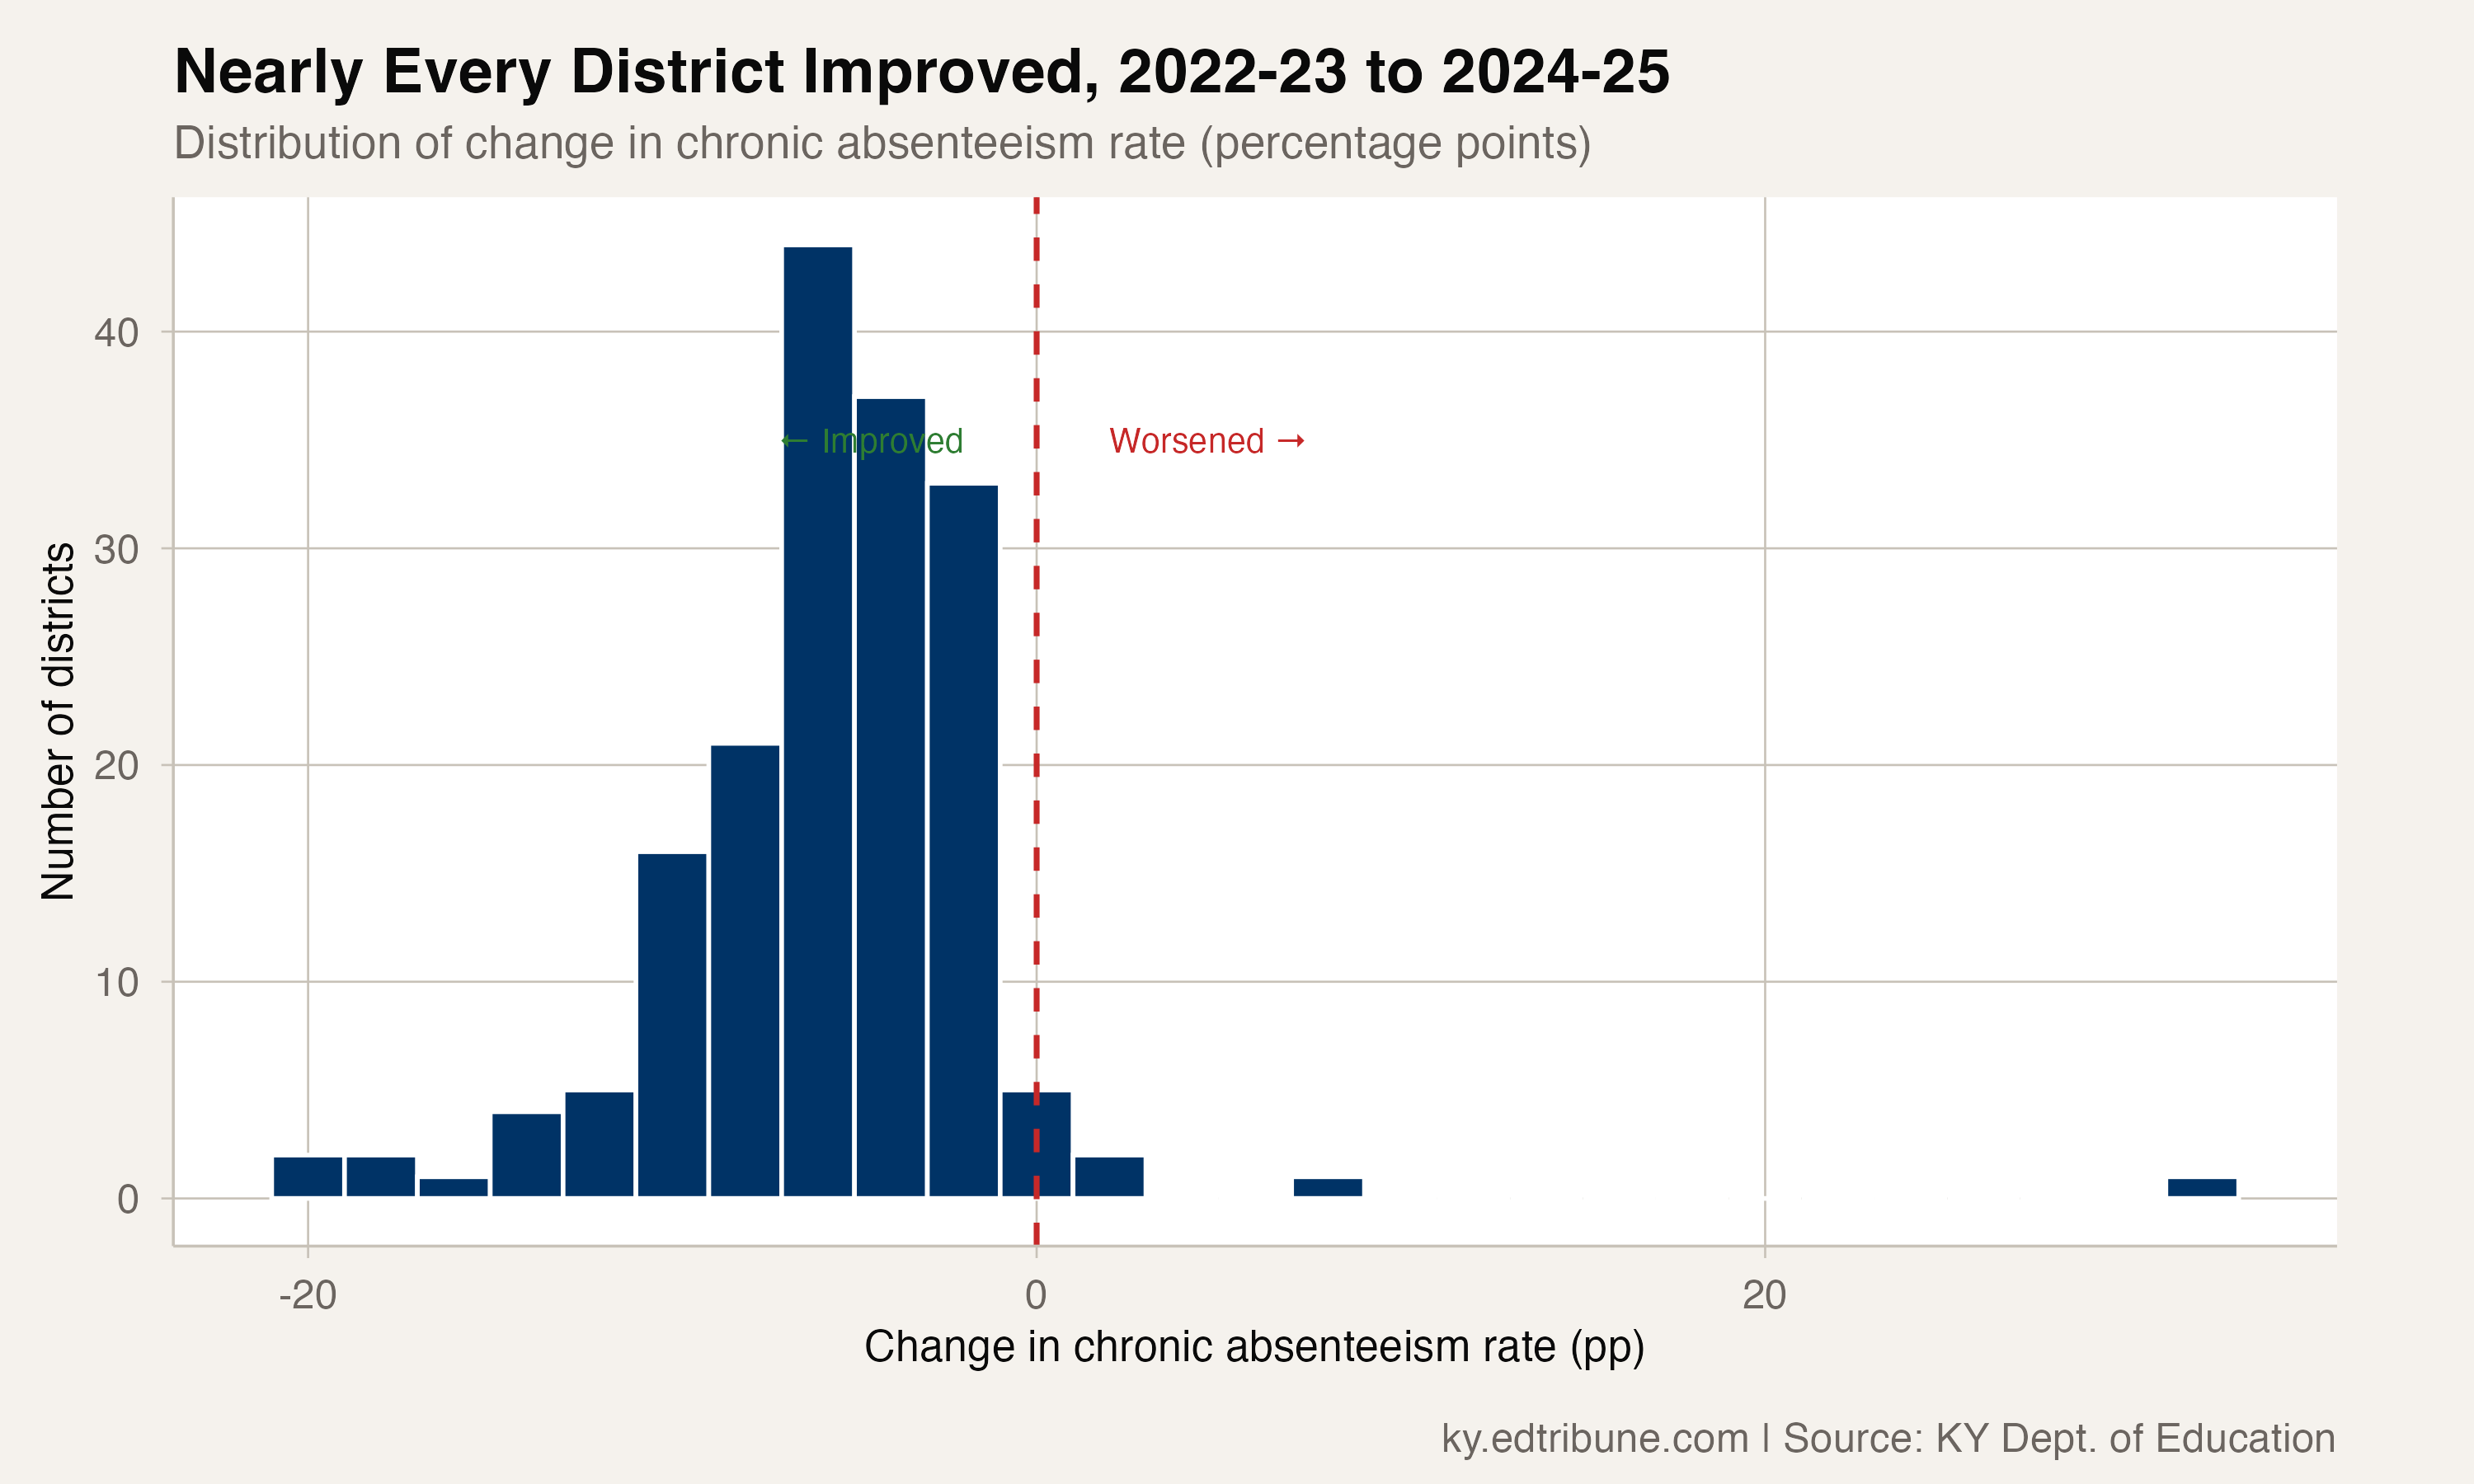
That breadth of improvement is the most striking feature of Kentucky's 2024-25 chronic absenteeism data. Of 174 districts with three years of records, 150 posted their lowest rate in the most recent year. Only six districts saw their chronic rate worsen over the period. The near-universality of the improvement suggests something beyond individual district efforts.
The scope of the improvement
Of 174 districts with full three-year histories, 168 improved their chronic absenteeism rate from 2022-23 to 2024-25 -- a 96.6% improvement rate that is unusual in education data, where any statewide initiative typically produces a bell curve of outcomes. The six districts that worsened include Cloverport Independent, a structural anomaly that absorbed what appears to be a virtual program and saw its enrollment jump from 292 to 3,552 students; Christian County, which edged up 0.9 points to 24.5%; and Bath County, which ticked up 0.9 points to 39.6%.
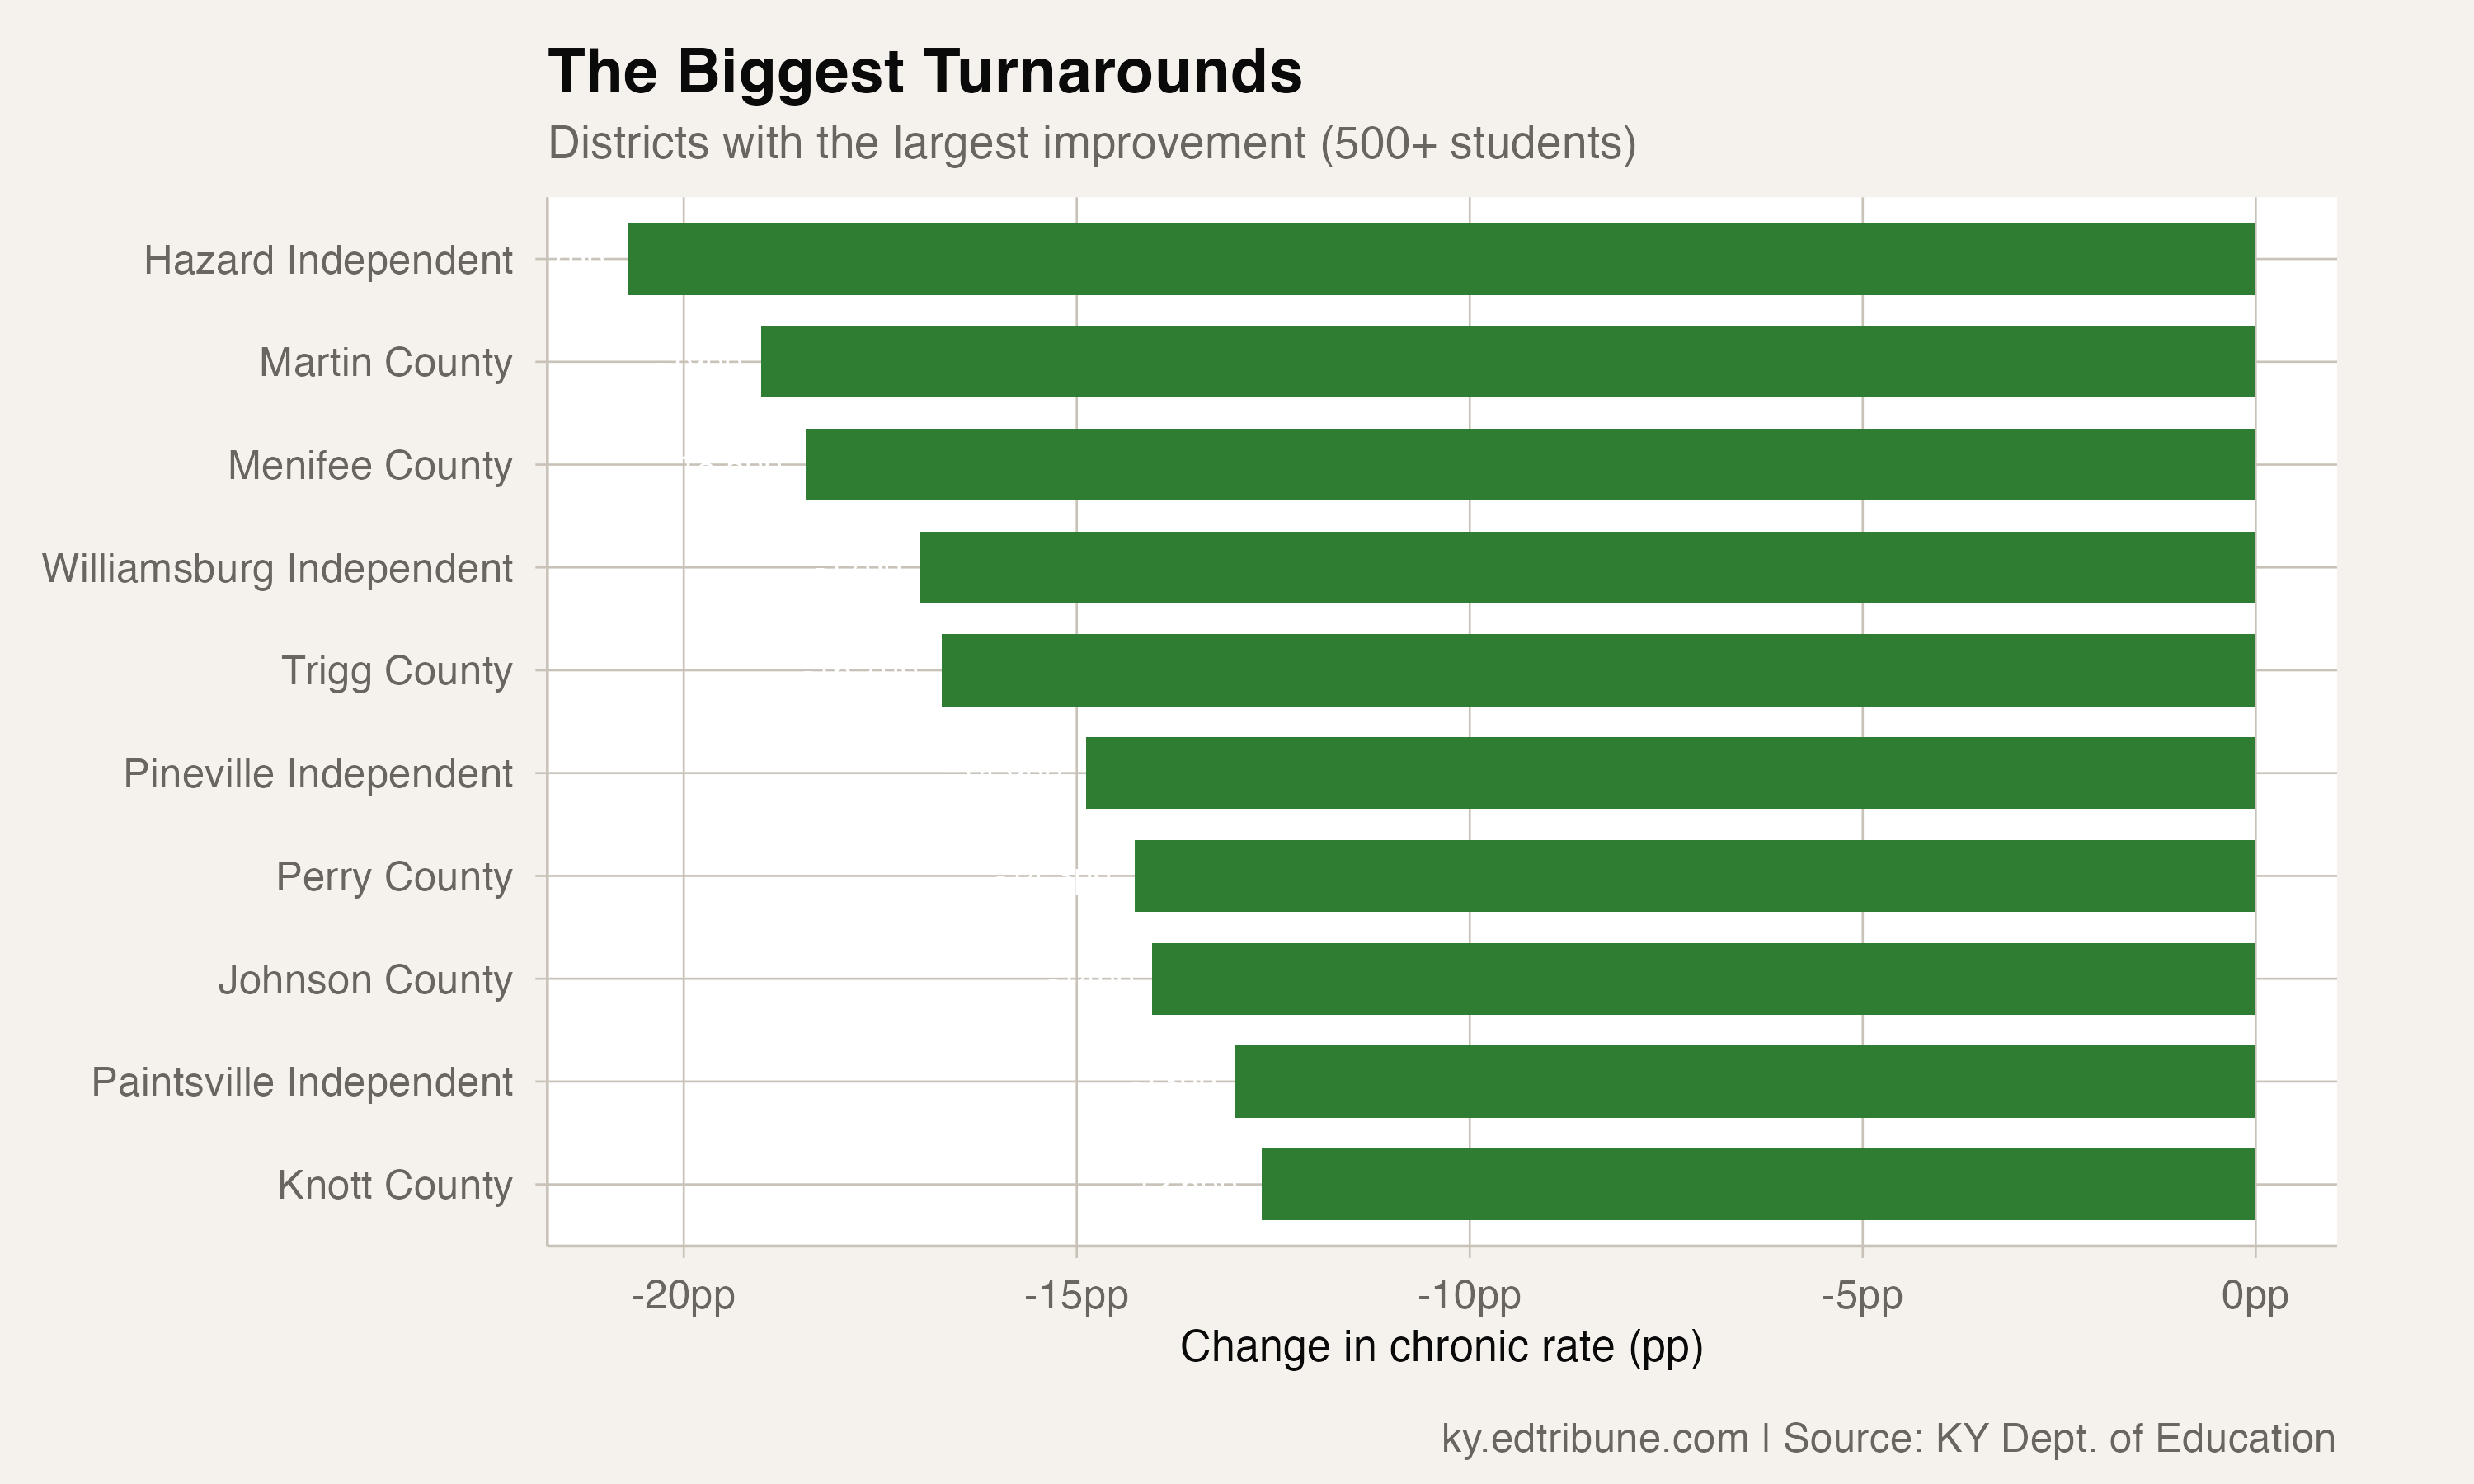
The improvements were not small. Hazard Independent dropped 20.7 percentage points. Martin County dropped 19.0. Menifee County dropped 18.5. Among districts with at least 500 students, 15 improved by more than 10 percentage points in two years. Even districts that started with low rates found room to improve: Oldham County went from 13.7% to 11.0%, and Boone County from 16.7% to 14.1%.
Why nearly everyone improved
When 96.6% of districts move in the same direction, the explanation is almost certainly systemic rather than local. Three statewide factors operated simultaneously.
Kentucky's HB 611, enacted in July 2024, strengthened truancy enforcement by requiring county attorney referrals at 15 unexcused absences and extending diversion agreements. The law applied equally to every district in the state. The SEEK funding formula, which ties per-pupil revenue to average daily attendance, gave every superintendent a fiscal reason to prioritize attendance regardless of their district's circumstances. And the general post-pandemic normalization of school attendance -- the fading of COVID-era habits around keeping children home -- likely contributed to improvement everywhere.
Whether any single factor accounts for most of the improvement is difficult to determine from three years of data. The uniformity of the gains, however, argues against crediting individual district programs.
The extremes that persist
The breadth of improvement does not erase the depth of the remaining problem. Even with best-ever rates, 15 Kentucky districts -- all in eastern Kentucky or the rural south -- exceed 40% chronic absenteeism. Harlan County's 51.6% is the highest rate among districts with at least 500 students. Magoffin County sits at 49.9%, Knott County at 48.6%.
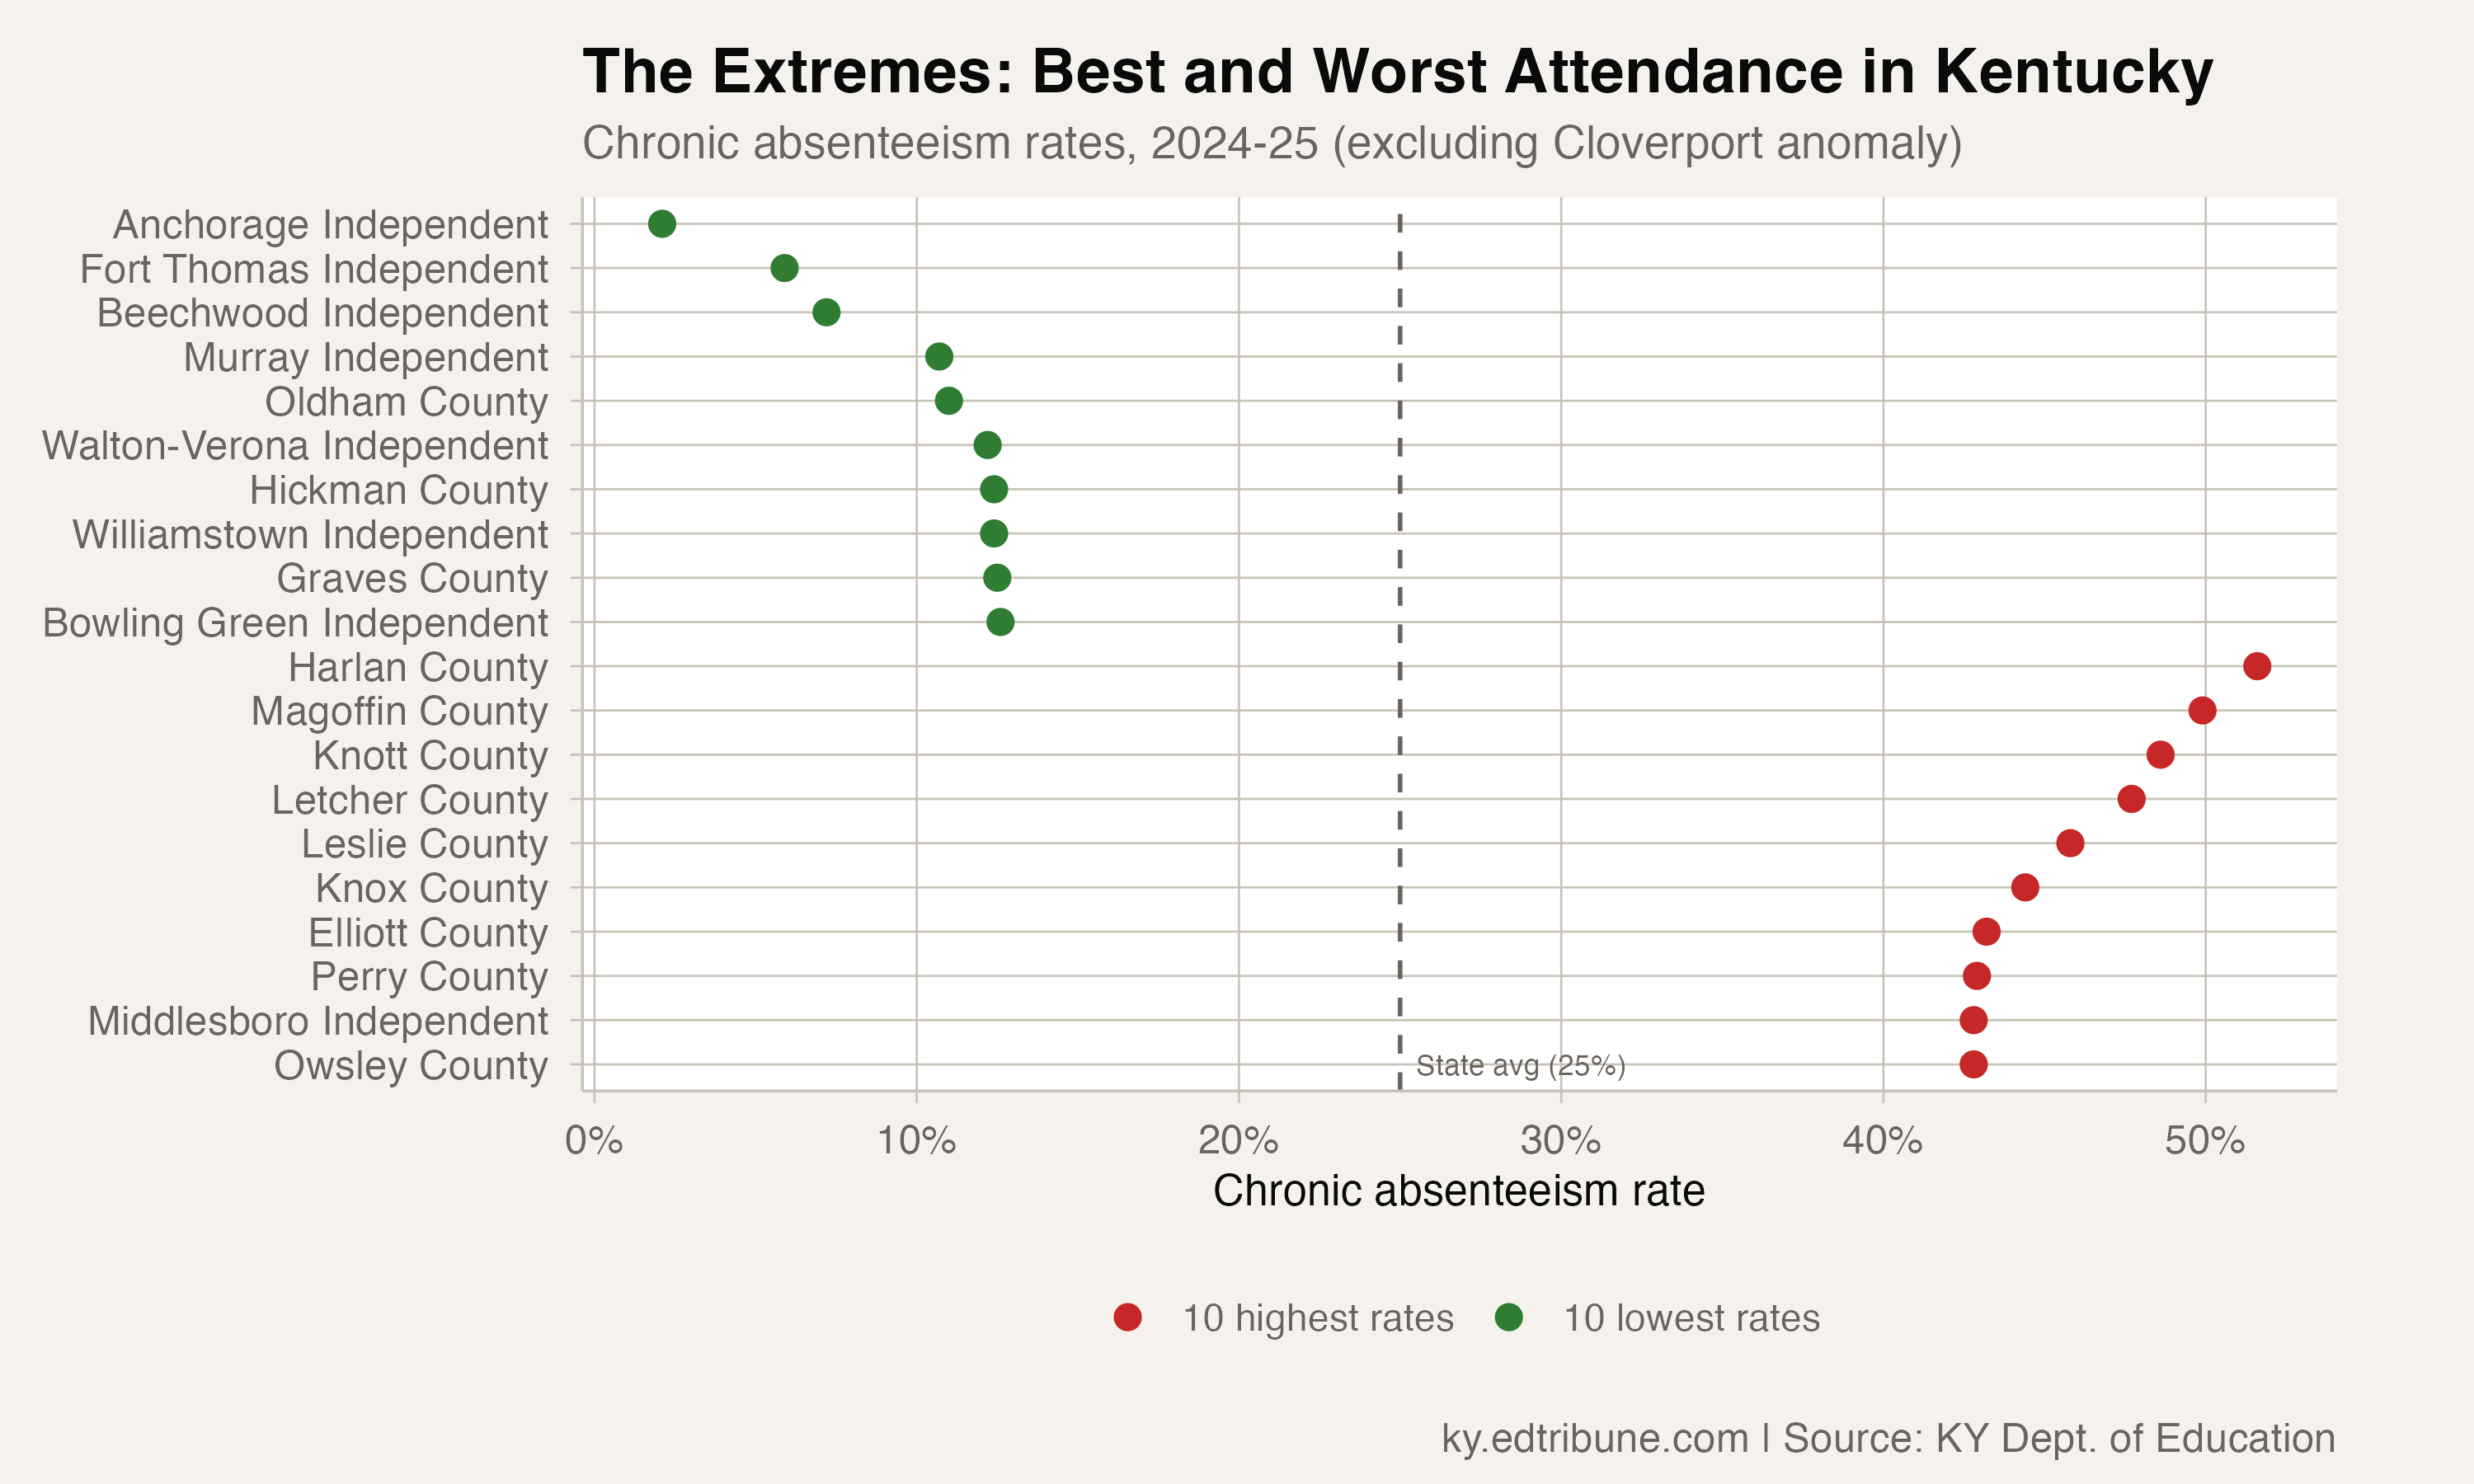
At the other extreme, Fort Thomas (5.9%), Beechwood Independent (7.2%), and Murray Independent (10.7%) post rates that would be considered strong even by pre-pandemic national standards. The gap between the top and bottom of Kentucky's distribution -- nearly 46 percentage points when excluding the Cloverport anomaly -- is wider than the gap between the best and worst performing states nationally.
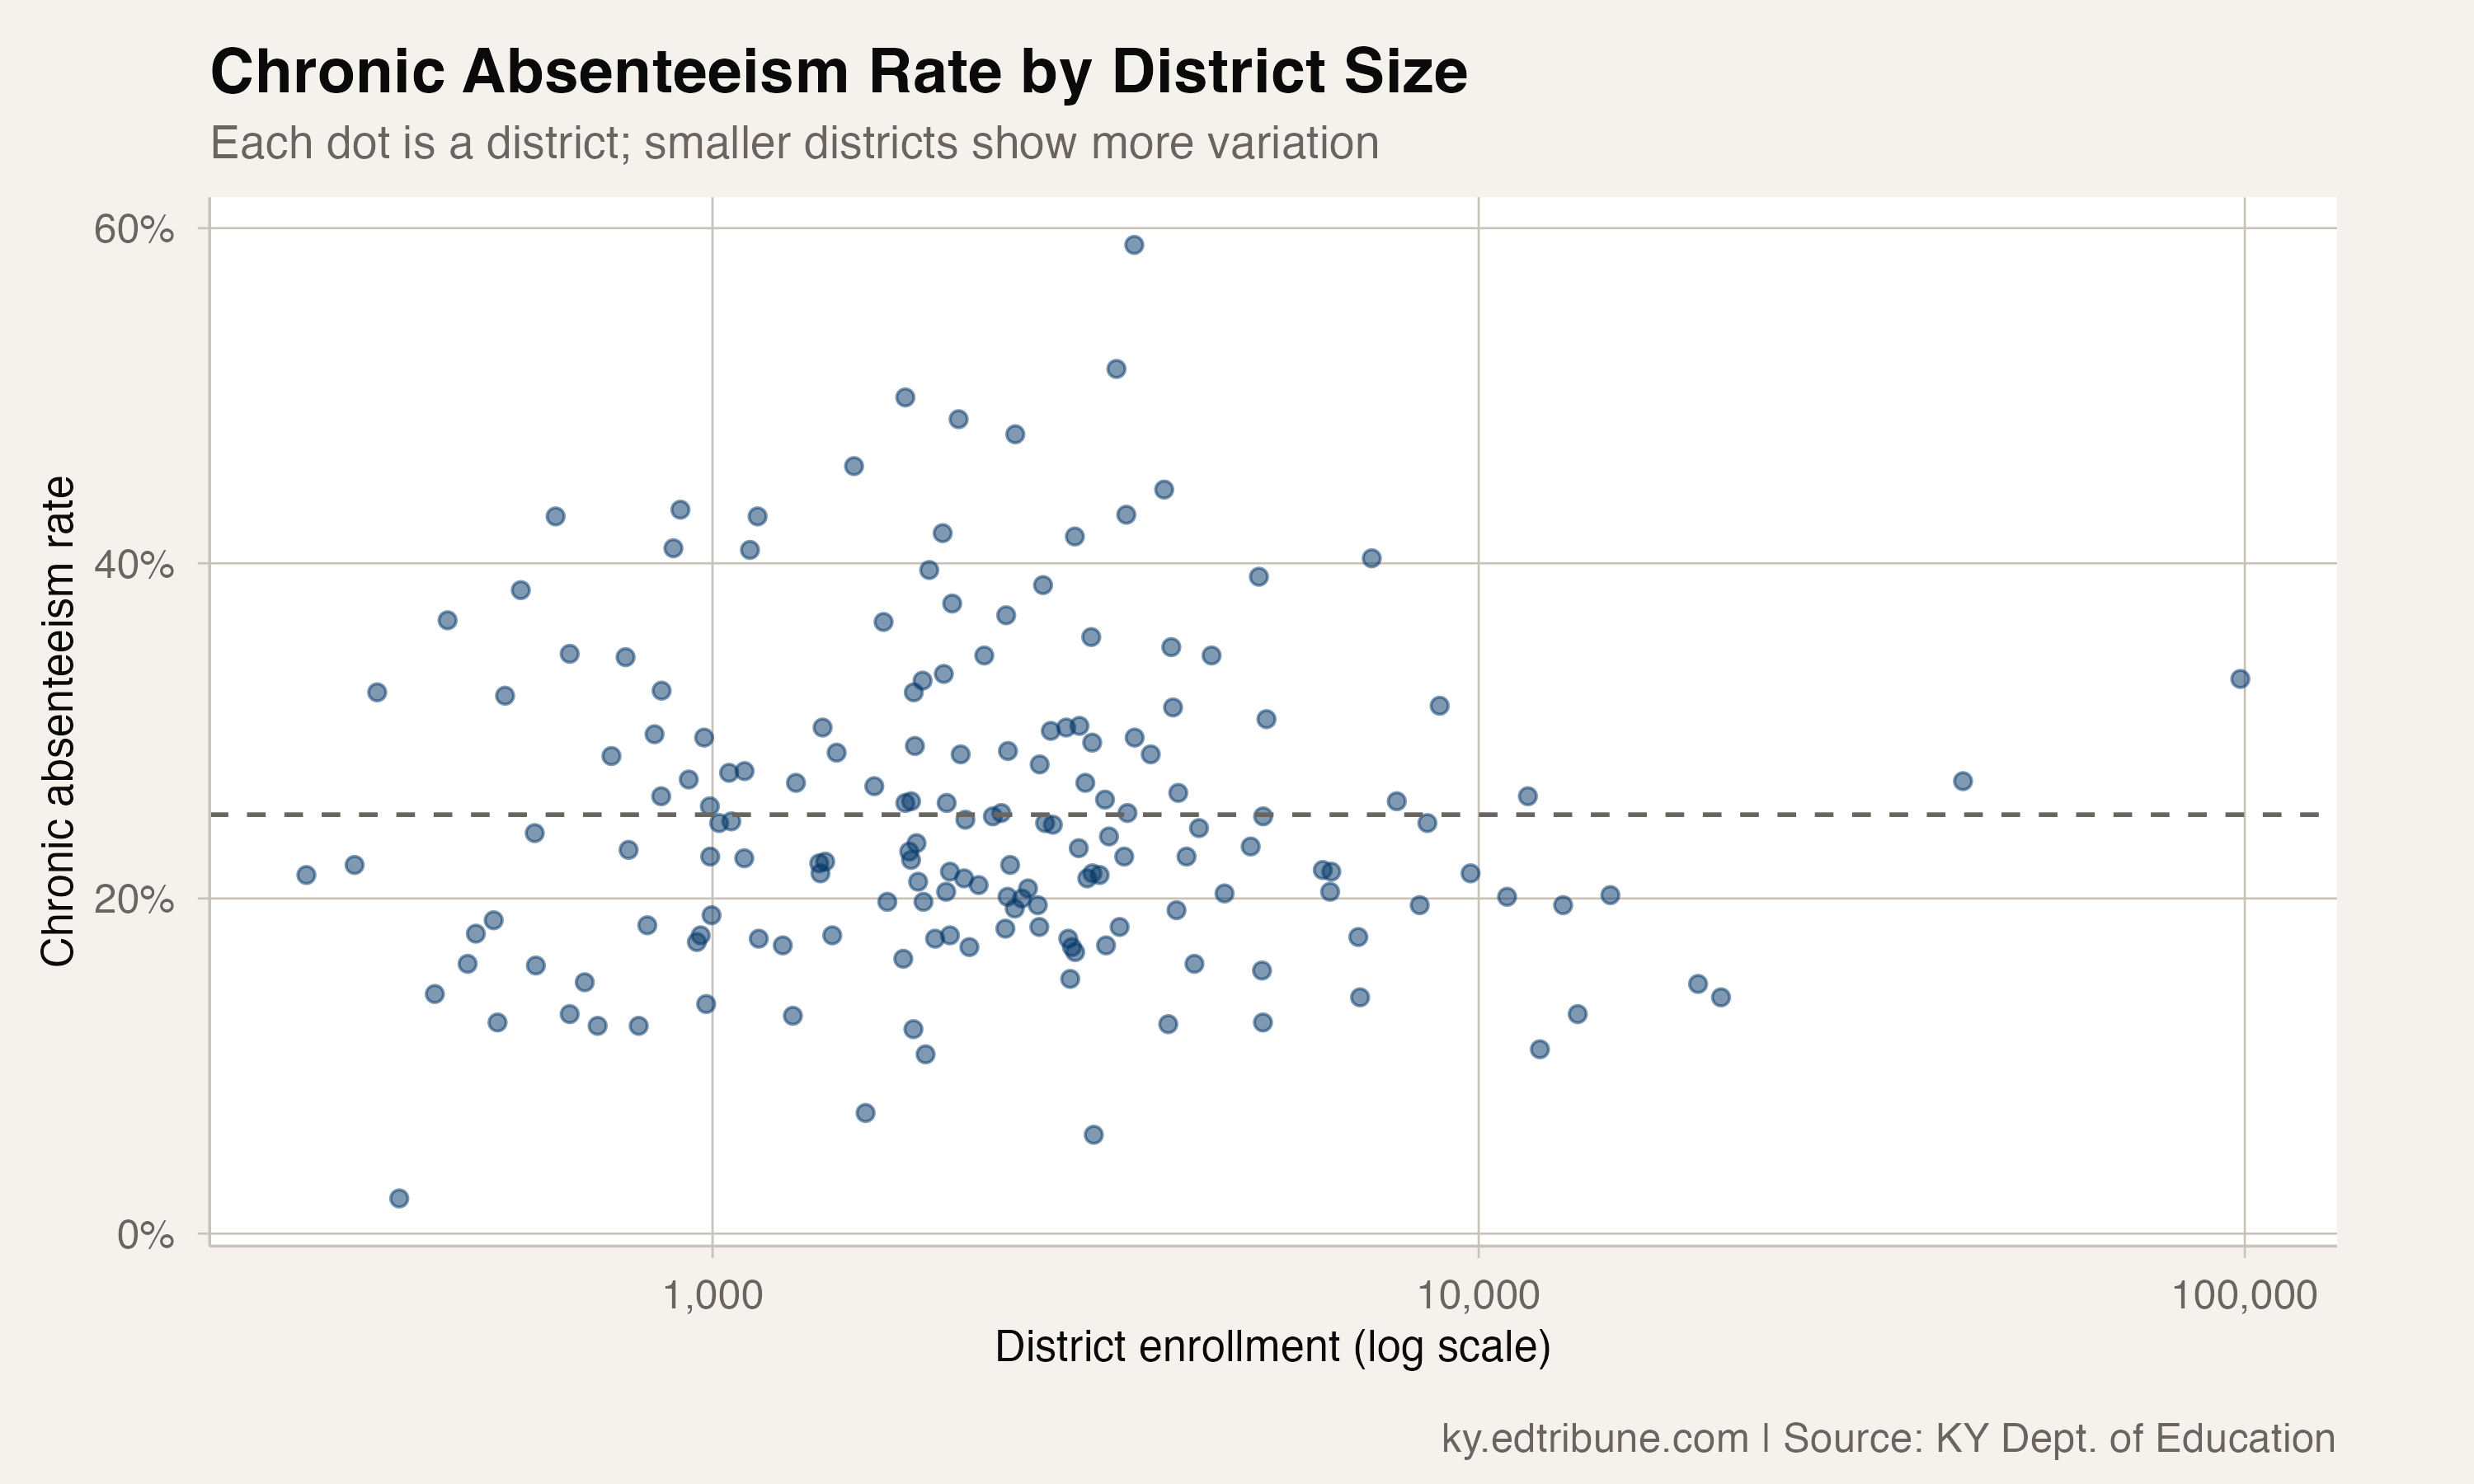
District size matters. Smaller districts show far more variation in chronic rates, a pattern common across states. The largest districts cluster closer to the state average, while districts under 2,000 students range from under 10% to over 50%. This volatility in small districts is partly statistical -- a few families can swing a rate by several points -- and partly structural, reflecting the concentration of poverty and geographic isolation in Kentucky's smallest school systems.
Best-ever is not the same as good
Fort Thomas at 5.9% and Harlan County at 51.6% are both at their best mark in three years. The gap between them -- 45.7 percentage points -- is a reminder that "record low" is relative to where you started. A district that improves from catastrophic to merely terrible still lands on the best-ever list.
The 150-district breadth of improvement argues for systemic causes. The 46-point spread within that improvement argues that systemic forces operate on very different raw material. Harlan County's SEEK-constrained budget, its mountain roads, its 30%-plus poverty rate -- these do not respond to the same levers that nudged Oldham County from 13.7% to 11.0%. Both improved. Only one is close to solving the problem.
Detailed code that reproduces the analysis and figures in this article is available exclusively to EdTribune subscribers.
Discussion
Sign in to join the discussion.
Loading comments...